Calculate the coefficient of concurrent deviations for the following data

Glencoe Algebra 1, Student Edition, 9780079039897, 0079039898, 2018
18th Edition
ISBN:9780079039897
Author:Carter
Publisher:Carter
Chapter10: Statistics
Section: Chapter Questions
Problem 11PT

Related questions
Question
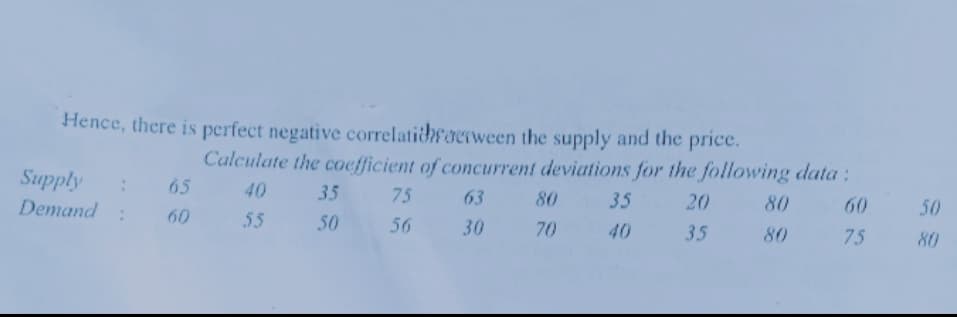
Transcribed Image Text:Hence, there is perfect negative correlatidhfaerween the supply and the price.
Calculate the coefficient of concurrent deviations for the following data :
Supply
Demand :
65
40
35
75
63
80
35
20
80
60
50
60
55
50
56
30
70
40
35
80
75
80
Expert Solution
This question has been solved!
Explore an expertly crafted, step-by-step solution for a thorough understanding of key concepts.

Step by step
Solved in 3 steps with 1 images

Recommended textbooks for you
Glencoe Algebra 1, Student Edition, 9780079039897…
Algebra
ISBN:
9780079039897
Author:
Carter
Publisher:
McGraw Hill
Glencoe Algebra 1, Student Edition, 9780079039897…
Algebra
ISBN:
9780079039897
Author:
Carter
Publisher:
McGraw Hill