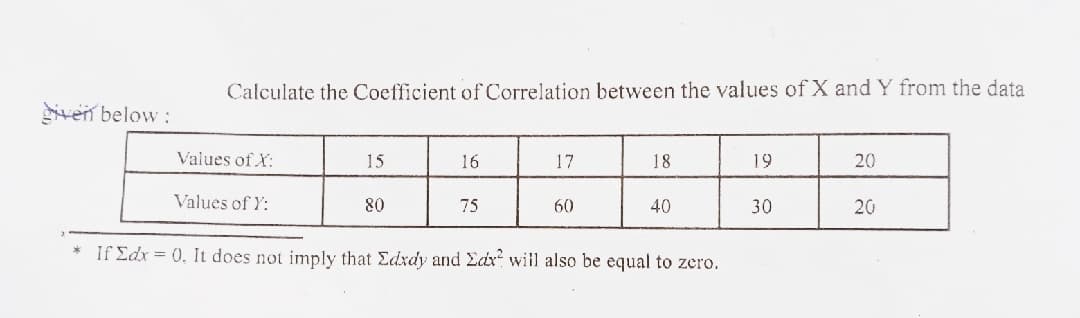
Calculate the Coefficient of Correlation between the values of X and Y from the data iven below : Values of X: 15 16 17 18 19 20 Values of Y: 80 75 60 40 30 20 * If Edx = 0., It does not imply that Edxdy and Edr will also be equal to zero.


Q: Assume that a firm has selected a random sample of 100 items from its production line and has obtain...
A:
Q: A wireless garage door opener has a code determined by the up or down setting of 11 switches. How ma...
A: Given: total number of switches, N=11
Q: 3. There are 12-person jury is randomly selected for a court trial from a pool of 20 men and 35 wome...
A:
Q: 5 points on his st. The mean was 70 standard deviation atively better on thein
A:
Q: 2. Regression analysis problem: Determine the correlation coefficient and coefficient of determinati...
A: The table shows X and Y values.
Q: Out of 300 people sampled, 261 preferred Candidate A. Based on this, estimate what proportion of the...
A:
Q: Because of the increased cost of housing, a national real estate board wants to compare the proporti...
A: From the provided information, the hypothesis, that if two proportions, i.e., the proportion of home...
Q: Which of the following is the best interpretation of the correlation coefficient
A: Given Information: The dependent variable y is the price of milk. The independent variable x is the ...
Q: H.:p = 0.34 Ha:p > 0.34 You obtain a sample of sizen = 183 in which there are 69 successful observat...
A:
Q: 1. I am using regression discontinuity to see if there is a relationship between receiving a scholar...
A:
Q: Parliament contains a proportion p of Labour Party members, incapable of changing their opinions abo...
A:
Q: Give an interpretation for the following histogram.
A: Given The histogram is given below:
Q: 5. In a sample of 500 children, 200 came from higher income group, and the rest from iower income gr...
A: Solution:
Q: You roll twO six-sided fair dice. a. Let A be the event that the first die is odd and the second is ...
A: Ans# Given, roll two six sided fair dice Sample space (S) = {(1,1), (1,2), (1,3)...
Q: Suppose that points are distributed over the half-line [0;1) according to a Poisson process of rate ...
A:
Q: Investment advisors estimated the stock market returns for four market segments: computers, financia...
A:
Q: A company makes electronic gadgets. One out of every 50 gadgets is faulty, but the company does not ...
A:
Q: Find these probabilities for a st (a) P(Z>0.8) (b) P(Z < - 2.2) (c) P(-0.9<Z<0.9)
A: I solved exactly first three subparts because of bartleby policy if you want more please upload sepa...
Q: 1. 3Y4 + 3Y5 + 3Y6+ ...+ 3Y15 2. (Xg — 4) + (X, — 4) + (Х10 — 4) + (X11 — 4) 3. (X3Y3) + (X4Y4) + …·...
A: To write in summation notation 1): 3 y4+3y5+.......3y15 2): (X8-4)+(X9-4).........(X11-4) 3): (X3...
Q: The change in temperature during the fall fluctuates randomly each day, with mean of -9°, and a stan...
A:
Q: The scores of individual student on the American College Testing (ACT) Program Compsite College Entr...
A: Given that - The scores of individual student on the American College Testing (ACT) Program Compsite...
Q: Assuming the footsizes of the U.K are normally distributed, do men and women differ in footsize in o...
A: Solution: The Microsoft Excel Data Analysis output for independent samples or group t test is
Q: Library Genesis Cartwright Learning Looking at Movies Following are the ages of the winners of the m...
A:
Q: Let Y denote the average age of the two children that are selected. What are all the different possi...
A: couple has 6 children. Jo, Co, are both 10 years old (they were twins), Joey is 8 years old, and Bet...
Q: Do you find any association between the tempers of brothers and sisters from the toHoving data : Goo...
A:
Q: 3. Police plan to enforce speed limits during the morning rush hour on four different routes into th...
A:
Q: If n=430 and (p-hat) = 0.67, construct a 90% confidence interval. Give your answers to three decima...
A: We have given that, Sample size (n) = 430 and sample proportion or point estimate (p̂) = 0.67 Then...
Q: of 49 minutes. What is the probability that students at a private university spend more time on Face...
A: here given, study was done to compare the amount of time per day students at public and private univ...
Q: Assume that the systolic blood pressure levels are normally distributed with a mean of 120 and a sta...
A:
Q: 3.74 An experiment results in one of three mutually exclusive events A, B, and C. It is known that P...
A: As per company guidelines I solved exactly three subparts of the question .thank you
Q: The following data are given to you to find out whether the distribution is platykurtie: N- 100, Σα-...
A:
Q: Determine the z-score given the following P(z<a)%3D0.8 P15
A: z be a standard normal random variable.z~N(0,1)
Q: 1. What is the data value associated with az-score of 0.4? 2. What is the data value associated with...
A:
Q: SHORT ANSWER. Write the word or phrase that best completes each statement or answers the question. C...
A: Given : A data set : Data 43 46 49 51 52 52 58 55 65 66 67 66 66 67 ...
Q: A binomial experiment is given. Decide whether you can use the normal distribution to approximate th...
A: Given that, n = 20, p =0.86 The conditions to use the normal distribution to approximate the binomia...
Q: The average height of 12 children is 124.7 with a standard deviation of 7.5 Assuming that the height...
A:
Q: 1 3 5 40 34 28 30 44 38 31 32 39 26 30 38 34 28 n debator was awarded 36 marks by Judge A while Judg...
A: *Answer:
Q: 26. A population of scores has u = 10 and o = 2. If every score in the population is multiplied by 4...
A: Given: μ=10σ=2
Q: Below is a variance component table generated from the G-study for a pxi design.
A: Note: Hi there! Thank you for posting the question. As you have posted multiple questions, as per th...
Q: Next, suppose that I am interested in the number of mutations at 10 locations for 100 patients. I s...
A: Given: The variable of interest is the number of mutations at one fixed location for 100 patients
Q: Find the following probabilities in the standard normal distribution. (a) P( z 3.16) (c) P(-2.22 <z...
A:
Q: You want to obtain a sample to estimate a population proportion. Based on previous evidence, you be...
A: Given that, P = 0.29, M.E = 0.025, Alpha = 0.10 than n = ?
Q: The following table gives the age of cars of a certain make and annual maintenance COst. Obtain the ...
A: Given data is Age of cars in years 2 4 6 8 Maintenance cost in hundred of Rs. 10 20 25 30
Q: Evaluate each of the following: 27 2 3i i=1 25 2. 3 i=7 1.
A:
Q: 12. Last year, in PSY 2080, Exam #3 produced a negatively skewed distribution. The median was = 85. ...
A: Given that the distribution is negatively skewed median =85 then mean =?
Q: The probability of the impossible event is zero, i.e., if ø is the subset (event) containing no samp...
A:
Q: For a standard normal distribution, find: P(z > 2.02) Express the probability as a decimal rounded ...
A: GivenP(z>2.02)
Q: How many ways can you arrange the letters from the word TEACHER? How many ways can you arrange the...
A: NOTE- I HAVE CALCULATED ALL THE PARTS
Q: In the university libtaty elevator there is a sign indicating a 16 person limit as well as a weight ...
A: Let X be the random variable from normal distribution with mean weight (μ) = 150 pounds, standard de...
Q: The average price for an acre of land in Texas is N(2700, 7802) in dollars. Jaime will survey 121...
A: Given Let the price of the plot be X X~N2700,7802Sample size, n=121

Step by step
Solved in 2 steps with 2 images

- Listed below are the overhead widths (in cm) of seals measured from photographs and the weights (in kg) of the seals. Construct a scatterplot, find the value of the linear correlation coefficient r, and find the critical values of r using α=0.01. Is there sufficient evidence to conclude that there is a linear correlation between overhead widths of seals from photographs and the weights of the seals? Overhead Width 7.1 7.6 9.7 9.4 8.8 8.2 Weight 111 198 246 204 202 185 Construct a scatterplot. Choose the correct graph below. (inserted as picture) The linear correlation coefficient is r=__________ (Round to three decimal places as needed.) The critical values are r= (_______,________) (Round to three decimal places as needed. Use a comma to separate answers as needed.) Because the absolute value of the linear correlation coefficient is (greater,less than, equal to) than the positive…Listed below are the overhead widths (in cm) of seals measured from photographs and the weights (in kg) of the seals. Construct a scatterplot, find the value of the linear correlation coefficient r, and find the critical values of r using α=0.05. Is there sufficient evidence to conclude that there is a linear correlation between overhead widths of seals from photographs and the weights of the seals? Overhead Width 7.0 7.6 9.6 9.2 8.8 8.3 Weight 111 159 242 193 205 187b. Find the linear correlation coefficient, r, then determine whether there is sufficient evidence to support the claim of a linear correlation between the two variables.
- Listed below are the overhead widths (in cm) of seals measured from photographs and the weights (in kg) of the seals. Construct a scatterplot, find the value of the linear correlation coefficient r, and find the critical values of r using α=0.01. Is there sufficient evidence to conclude that there is a linear correlation between overhead widths of seals from photographs and the weights of the seals? Overhead Width 7.1 7.7 9.7 9.4 8.7 8.3 Weight 111 201 242 204 197 192 Construct a scatterplot. Choose the correct graph below. The linear correlation coefficient is r=enter your response here. (Round to three decimal places as needed.) The critical values are r=enter your response here. (Round to three decimal places as needed. Use a comma to separate answers as needed.)Listed below are the overhead widths (in cm) of seals measured from photographs and the weights (in kg) of the seals. Construct a scatterplot, find the value of the linear correlation coefficient r, and find the critical values of r using α=0.05. Is there sufficient evidence to conclude that there is a linear correlation between overhead widths of seals from photographs and the weights of the seals? Overhead Width 7.1 7.7 9.8 9.2 8.7 8.3 Weight 112 204 245 194 198 187 1. Construct a scatterplot graph 2. The linear correlation coefficient r is 3. The critical values are r= 4. Because the absolute value of the linear correlation coefficient is_____than the positive critical value, there___sufficient evidence to support the claim that there is a linear correlation between overhead widths of seals from photographs and the weights of the seals for a significance level of α=0.05.Here is a bivariate data set.x y71 461 555 6148 -876 3126 7074 -62 Find the correlation coefficient and report it accurate to four decimal places.r =
- Listed below are the overhead widths (in cm) of seals measured from photographs and the weights (in kg) of the seals. Construct a scatterplot, find the value of the linear correlation coefficient r, and find the critical values of r using α=0.05. Is there sufficient evidence to conclude that there is a linear correlation between overhead widths of seals from photographs and the weights of the seals? Overhead Width 7.1 7.7 9.7 9.4 8.6 8.2 Weight 111 181 245 203 197 183 The linear correlation coefficient is r=enter your response here. (Round to three decimal places as needed.) The critical values are r=enter your response here. (Round to three decimal places as needed. Use a comma to separate answers as needed.) Because the absolute value of the linear correlation coefficient is ▼ less greater than the positive critical value, there ▼ is not is sufficient evidence to support the claim that there is a linear…Find the coefficient of determination, given that the value of the linear correlation coefficient, r, is 0.681. (Round to four decimal places.)The following table shows the magnitude of earthquakes on the Richter scale, x, and the corresponding depth of the earthquakes (in kilometers) below the surface at the epicenter of the earthquake. Find the correlation coefficient of the following pairs of data: x = earthquake magnitude 2.9 4.2 3.3 4.5 2.6 3.2 3.4 y = depth of earthquake (in km) 5 10 11.2 10 7.9 3.9 5.5
- b.Find the linear correlation coefficient, r, then determine whether there is sufficient evidence to support the claim of a linear correlation between the two variables. c. find the critical valuesCompute r, the correlation coefficient, using the following data. R=_____ (round to three decimal places)