Calculate the mean and sample standard deviation of both the independent and dependent variables. Calculate the correlation coefficient, r, using Excel's CORREL function. Explain what it means. Calculate the coefficient of determination, r2, using Excel's RSQ function. Explain what it means. a very high score. port your results here:
Calculate the mean and sample standard deviation of both the independent and dependent variables. Calculate the correlation coefficient, r, using Excel's CORREL function. Explain what it means. Calculate the coefficient of determination, r2, using Excel's RSQ function. Explain what it means. a very high score. port your results here:

Glencoe Algebra 1, Student Edition, 9780079039897, 0079039898, 2018
18th Edition
ISBN:9780079039897
Author:Carter
Publisher:Carter
Chapter4: Equations Of Linear Functions
Section4.5: Correlation And Causation
Problem 11PPS

Related questions
Question
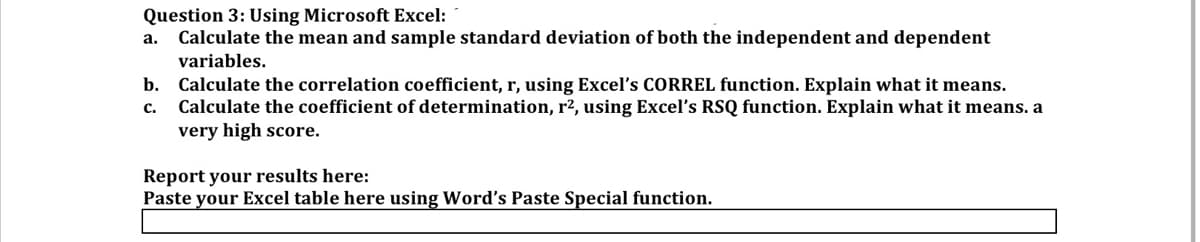
Transcribed Image Text:Question 3: Using Microsoft Excel:
Calculate the mean and sample standard deviation of both the independent and dependent
а.
variables.
b.
Calculate the correlation coefficient, r, using Excel's CORREL function. Explain what it means.
Calculate the coefficient of determination, r², using Excel's RSQ function. Explain what it means. a
very high score.
с.
Report your results here:
Paste your Excel table here using Word's Paste Special function.
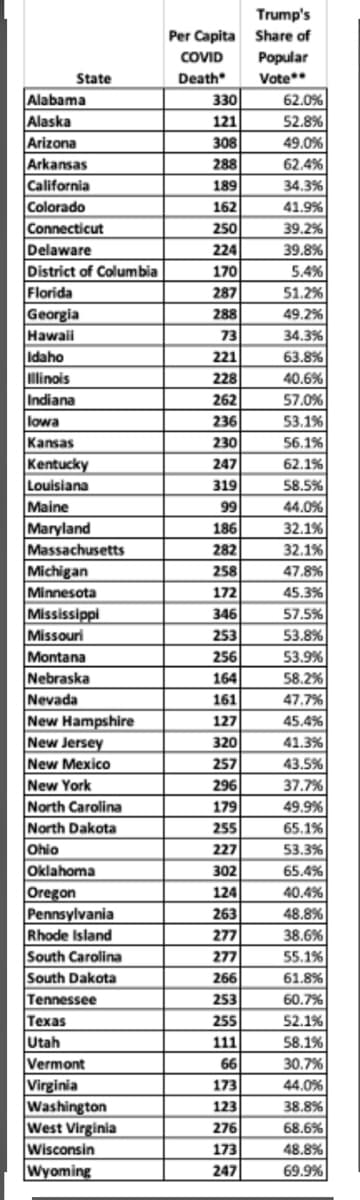
Transcribed Image Text:Trump's
Per Capita Share of
COVID
Popular
Death
330
State
Vote**
Alabama
Alaska
62.0%
121
52.8%
308
288
Arizona
49.0%
Arkansas
California
Colorado
62.4%
189
34.3%
162
41.9%
Connecticut
250
39.2%
224
39.8%
Delaware
District of Columbia
Florida
Georgia
Hawaii
170
5.4%
287
51.2%
288
49.2%
73
34.3%
Idaho
221
63.8%
Illinois
228
40.6%
Indiana
lowa
0%.ר5
53.1%
262
236
Kansas
230
56.1%
Kentucky
Louisiana
247
62.1%
58.5%
44.0%
319
Maine
Maryland
Massachusetts
Michigan
Minnesota
99
186
282
32.1%
32.1%
258
47.8%
172
45.3%
Mississippi
Missouri
Montana
Nebraska
Nevada
New Hampshire
New Jersey
New Mexico
New York
North Carolina
North Dakota
Ohio
346
57.5%
253
53.8%
256
53.9%
164
58.2%
161
47.7%
127
45.4%
320
41.3%
43.5%
37.7%
257
296
179
49.9%
255
65.1%
227
53.3%
Oklahoma
302
65.4%
Oregon
Pennsylvania
Rhode Island
South Carolina
South Dakota
124
40.4%
263
48.8%
277
38.6%
277
55.1%
266
61.8%
Tennessee
253
60.7%
Texas
255
52.1%
Utah
111
58.1%
Vermont
Virginia
Washington
West Virginia
66
30.7%
173
44.0%
123
38.8%
276
68.6%
Wisconsin
173
48.8%
Wyoming
247
69.9%
Expert Solution
This question has been solved!
Explore an expertly crafted, step-by-step solution for a thorough understanding of key concepts.

Step by step
Solved in 3 steps with 5 images

Recommended textbooks for you
Glencoe Algebra 1, Student Edition, 9780079039897…
Algebra
ISBN:
9780079039897
Author:
Carter
Publisher:
McGraw Hill
Glencoe Algebra 1, Student Edition, 9780079039897…
Algebra
ISBN:
9780079039897
Author:
Carter
Publisher:
McGraw Hill