Fifteen adult males between the ages of 35 and 50 participated in a study to evaluate the effect of diet and exercise on blood cholesterol levels. The total cholesterol was measured in each subject initially and then 5 months after participating in an aerobic exercise program and switching to a low-fat diet, as shown in the table below. e People e 1서 24 34 4터 54 6 74 84 9 10Variancle Before e 264 241 258 295 251 245 286 314 260 279 555.57 After e 228 232 227 240 238 241 234 256 247 239 76.84 (a) Calculate the (before and after) sample mean and standard deviation; e (b) Calculate other relevant sample statistics, i.e, median, 1st and 3rd quartiles, range and inter-quartile range; e (c) Construct a comparative box-plot for "before" and "after" cholesterol data and discuss your observations; - (d) Use tally charts / counts to calculate frequencies (use 5 bins) and construct histograms for the 2 sets of data; e
Fifteen adult males between the ages of 35 and 50 participated in a study to evaluate the effect of diet and exercise on blood cholesterol levels. The total cholesterol was measured in each subject initially and then 5 months after participating in an aerobic exercise program and switching to a low-fat diet, as shown in the table below. e People e 1서 24 34 4터 54 6 74 84 9 10Variancle Before e 264 241 258 295 251 245 286 314 260 279 555.57 After e 228 232 227 240 238 241 234 256 247 239 76.84 (a) Calculate the (before and after) sample mean and standard deviation; e (b) Calculate other relevant sample statistics, i.e, median, 1st and 3rd quartiles, range and inter-quartile range; e (c) Construct a comparative box-plot for "before" and "after" cholesterol data and discuss your observations; - (d) Use tally charts / counts to calculate frequencies (use 5 bins) and construct histograms for the 2 sets of data; e

Glencoe Algebra 1, Student Edition, 9780079039897, 0079039898, 2018
18th Edition
ISBN:9780079039897
Author:Carter
Publisher:Carter
Chapter10: Statistics
Section10.6: Summarizing Categorical Data
Problem 10CYU

Related questions
Question
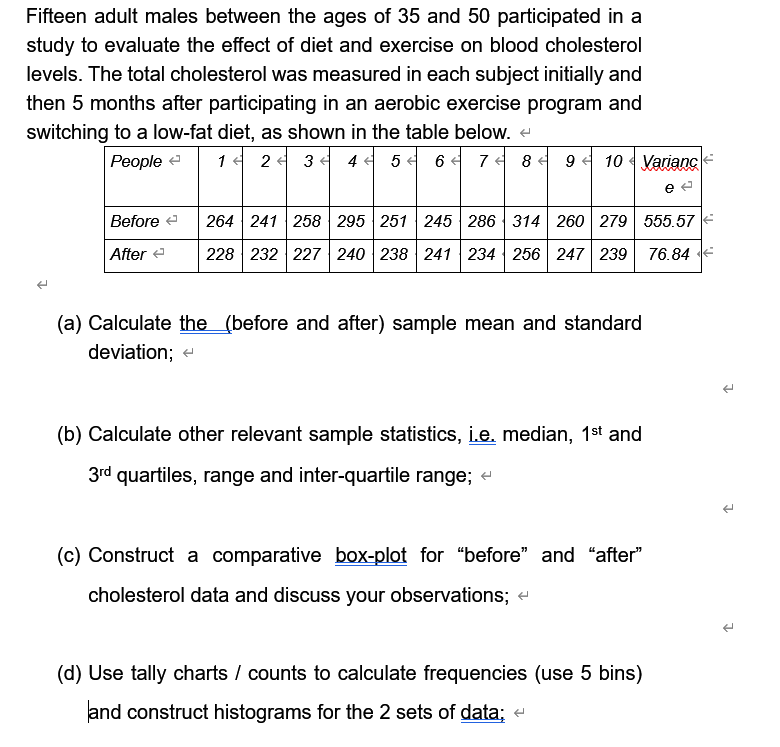
Transcribed Image Text:Fifteen adult males between the ages of 35 and 50 participated in a
study to evaluate the effect of diet and exercise on blood cholesterol
levels. The total cholesterol was measured in each subject initially and
then 5 months after participating in an aerobic exercise program and
switching to a low-fat diet, as shown in the table below. e
People e
1서 24 34 4터 54 6 74 84 9 10Variancle
Before e
264 241 258 295 251 245 286 314 260 279 555.57
After e
228 232 227 240 238 241 234 256 247 239
76.84
(a) Calculate the (before and after) sample mean and standard
deviation; e
(b) Calculate other relevant sample statistics, i.e, median, 1st and
3rd quartiles, range and inter-quartile range; e
(c) Construct a comparative box-plot for "before" and "after"
cholesterol data and discuss your observations; -
(d) Use tally charts / counts to calculate frequencies (use 5 bins)
and construct histograms for the 2 sets of data; e
Expert Solution
This question has been solved!
Explore an expertly crafted, step-by-step solution for a thorough understanding of key concepts.

This is a popular solution!

Trending now
This is a popular solution!

Step by step
Solved in 4 steps with 4 images

Recommended textbooks for you
Glencoe Algebra 1, Student Edition, 9780079039897…
Algebra
ISBN:
9780079039897
Author:
Carter
Publisher:
McGraw Hill

Big Ideas Math A Bridge To Success Algebra 1: Stu…
Algebra
ISBN:
9781680331141
Author:
HOUGHTON MIFFLIN HARCOURT
Publisher:
Houghton Mifflin Harcourt

Holt Mcdougal Larson Pre-algebra: Student Edition…
Algebra
ISBN:
9780547587776
Author:
HOLT MCDOUGAL
Publisher:
HOLT MCDOUGAL
Glencoe Algebra 1, Student Edition, 9780079039897…
Algebra
ISBN:
9780079039897
Author:
Carter
Publisher:
McGraw Hill
Big Ideas Math A Bridge To Success Algebra 1: Stu…
Algebra
ISBN:
9781680331141
Author:
HOUGHTON MIFFLIN HARCOURT
Publisher:
Houghton Mifflin Harcourt
Holt Mcdougal Larson Pre-algebra: Student Edition…
Algebra
ISBN:
9780547587776
Author:
HOLT MCDOUGAL
Publisher:
HOLT MCDOUGAL