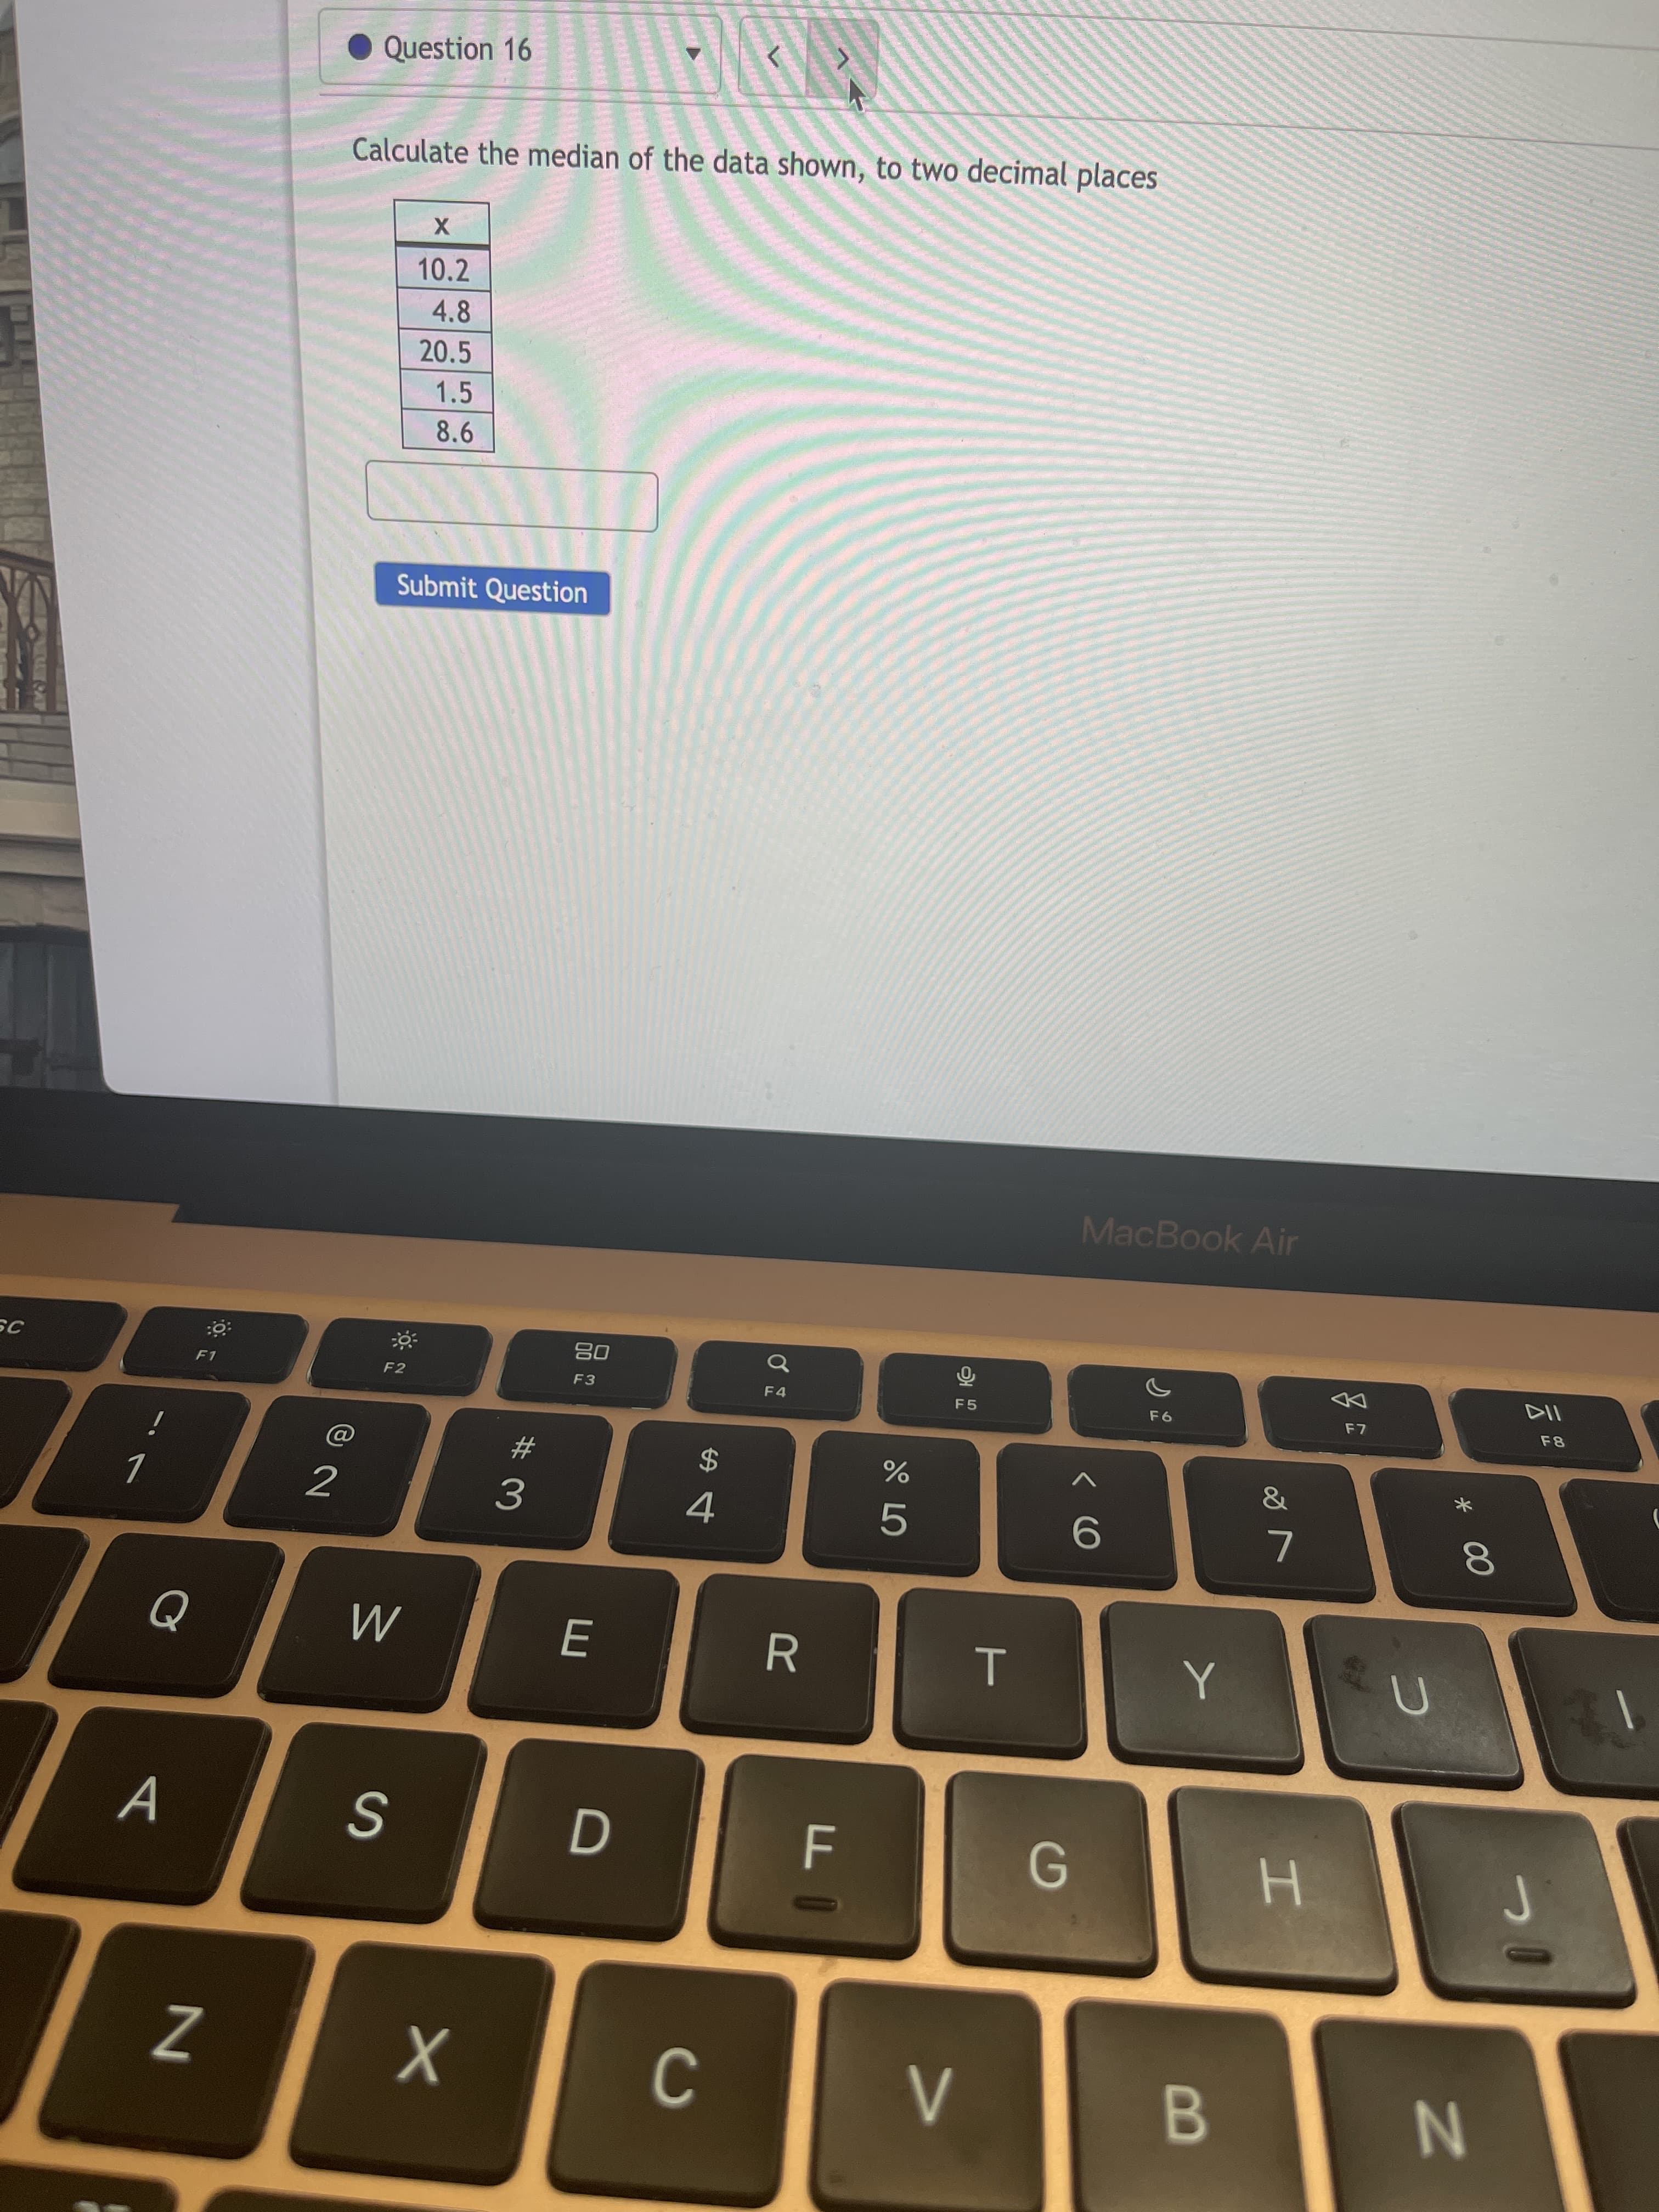
Calculate the median of the data shown, to two decimal places
Q: The trimmed mean is
A: From the data, the smallest observed value is 0.77, and largest observed value is 0.97. By removing…
Q: Find the variance for this data set of salaries 30, 34, 52, 48, 25, 36, 27 Round the…
A: The mean of the sample data can be obtained as:
Q: Complete the frequency distribution for the data.
A: here data represent age of 30 lottery winners from given data frquency distribution is as follow in…
Q: Given the histogram .Calculate the median.
A:
Q: Make an analysis about the data gathered.
A: The descriptive statistics is used to make summarization of the given data, where measure of central…
Q: what is an average
A: You want a meaning of average.You know average is also called as mean which is one of the Measures…
Q: The 70th percentile of the data presented in the table above is
A:
Q: A data set consists of 83 observations. How many classes would you recommend for a frequency…
A: Selection of number of classes:“2 to the k rule” suggests that the number of classes is the smallest…
Q: Calculate (x-bar) for the data shown, to two decimal places 20.5 5.8 1.4 15.4 22.3 6.5
A:
Q: Based on this histogram, draw the ogive (the cumulative relative frequency polygon) for the data.
A: By using the given histogram, the cumulative relative frequency is, Selling time Relative…
Q: Akiko surveyed several friends, asking them how many siblings they had. Use this data to find the…
A:
Q: What is the mean of the current data set? Show your work using the sketchpad below.
A: Measure of central tendency measures the central or average value of a dataset. Measured of…
Q: The table displays the scores of students on a recent exam. Find the mean of the scores to the…
A:
Q: Calculate (x-bar) for the data shown, to two decimal places
A: Calculate Mean from the following data17.9,2.6,6.3,16.4,24.2,26.1,18.7,18.4,9.1,5.7
Q: What is the bin in this dataset to calculate the frequency?
A: Country beer_servings Spirit_servings Wine_servings Total_litres_of_pure_alhocol Afganisthan 0 0 0…
Q: Please, find the Harmonic Mean of the given data. ASAP Monthly rent less than (Rs.) 10 20…
A: Given Monthly rent less than (Rs.) 10 20 30 40 50 60 70 80 Number of…
Q: Use your cumulative frequency diagram to estimate (i) the median value
A: The provided frequency distribution is Class Frequency (f) cf 16-25 8 8 26-35 32 40 36-45…
Q: The deviation of an entry x in a population data set is the difference between the entry and the…
A: Note: Hi there! Thank you for posting the question. It is considered that the deviation is taken…
Q: Find the estimated mean speed
A: Given Information: Speed (mph) Cars 30-39 7 40-49 16 50-59 51 60-69 16 70-79 10 To…
Q: Find the mean of the 12 sampled ratios. =
A: Mean is defined as the sum of observations divided by number of observations. Number of observations…
Q: What happens to the median and mean
A: We have to find the mean and median
Q: What is the median? (Round off to one decimal place if necessary)
A: Calculate Median from the following data1,2,2,3,3,4,4,5,6,6,7,7,7,7,8,8,8,9,9,10 for even number of…
Q: Determine the: a. Range b. Mean c. Median
A: As per our guidelines, we are allowed to answer first three sub-parts. Thanks a) The data in…
Q: What is the median for the dataset?
A: Here Dot-plot represents results from sample of 13 adults First we will represent the Data on number…
Q: For paired observations, the value of the average difference is?
A: Detaild Explanation Given In Attached File kindly Refer.
Q: Calculate mean froim following data keeping in view the
A: Mean = Mean is a sum of observations divided by number of observations. Mean = Σ(fi * Xi)/Σfi
Q: The mean of the population is (Round to two decimal places as needed.)
A: The population is 508, 634, 545, 611 and 577.
Q: State whether the data described below are discrete or continuous, and explain why. The exact…
A: Given: The exact distances (in centimeters) between the chairs in a college classroom.
Q: State whether the data described below are discrete or continuous, and explain why. The widths (in…
A: Given Information: State whether the data described below are discrete or continuous. The widths (in…
Q: For the frequency distribution table below, find the median *
A: Median is the middle most value of arranged data. For frequency distribution the median is defined…
Q: Below is a box plot representing hours that teenagers spend on video games per week.
A: In box plot,
Q: For the frequency table shown below, answer the following questions. 1.What is the median of the…
A: Given data : 0,0,0,0,0,1,1,1,1,1,1,1,1,1,2,2,2,2,3,3,4,4,4
Q: The histogram shows the distribution of hurricanes that have hit a country from 1851 through 2015,…
A:
Q: Which is the line of best fit for the data shown in the table?
A:
Q: Find the median value
A: Given information: The probability density function of a random variable X is as given below:
Q: The box plots below show student grades on the most recent exam compared to overall grades in a…
A: EXPLANATION: As we can see from box plot that class have the median 85(approx.) and the exam have…
Q: State whether the data described below are discrete or continuous, and explain why.
A: The data is said to be continuous if can take any value whether integer or decimal. The data is said…
Q: Given the mean of a certain data set as 115, what will be its new mean if all the data points were…
A:
Q: The percentile corresponding to the data value 25 is
A: Percentile is the location measure. It divide the data set into 100 equal parts with 99 points.…
Q: The mean # of hours worked
A: To find the mean number of hours worked by college students outside the home: Mean is a measure of…
Q: The Centers for Disease Control and Prevention recommends that adults get between 7-8 hours of sleep…
A: The median is middle value of the ordered data set.
Q: What is the median month? (Round off to one decimal place if necessary)
A: Calculate Median from the following data6,6,2,12,17,48,60,24,20,20,18,15 for even number of data set…
Q: If the median of a data set is 760, the upper quartile is 950, and the lower quartile is 650, what…
A: Given: Median = Q2 = 760, Upper quartile = Q3 = 950, Lower quartile = Q1 = 650.
Q: Use the dot plots to find the mean, median, and IQR of each class. Round to 1 decimal place, if…
A: There are two classes A and B having the dot plots.
Q: Find the weighted mean
A: The average number of people who feel sleepy Number Weighting Factor(Number of days in a week)…
Q: The Centers for Disease Control and Prevention recommends that adults get between 7-8 hours of sleep…
A: We have given that Dot plot We want to find median. Median = middle value of the data set.
Q: The mean is (Round to three decimal places as needed.)
A: Given : n=100 , p=23.9%=0.239 Our aim is to find the mean. Here , we use the binomial distribution.…
Q: Find the z score for test scores of 70 _____ and 90 ______.
A: The z-score of a sample data is Here, mean is 70.3 and standard deviation is 13.5.
Q: For data on "volumes of milk dispensed into 2-gallon milk cartons," should you use the mean or the…
A: Mean is the measure of central tendency which is the generally considered the best measure of…
Trending now
This is a popular solution!
Step by step
Solved in 2 steps