What is the bin in this dataset to calculate the frequency?

MATLAB: An Introduction with Applications
6th Edition
ISBN:9781119256830
Author:Amos Gilat
Publisher:Amos Gilat
Chapter1: Starting With Matlab
Section: Chapter Questions
Problem 1P

Related questions
Question
What is the bin in this dataset to calculate the frequency?
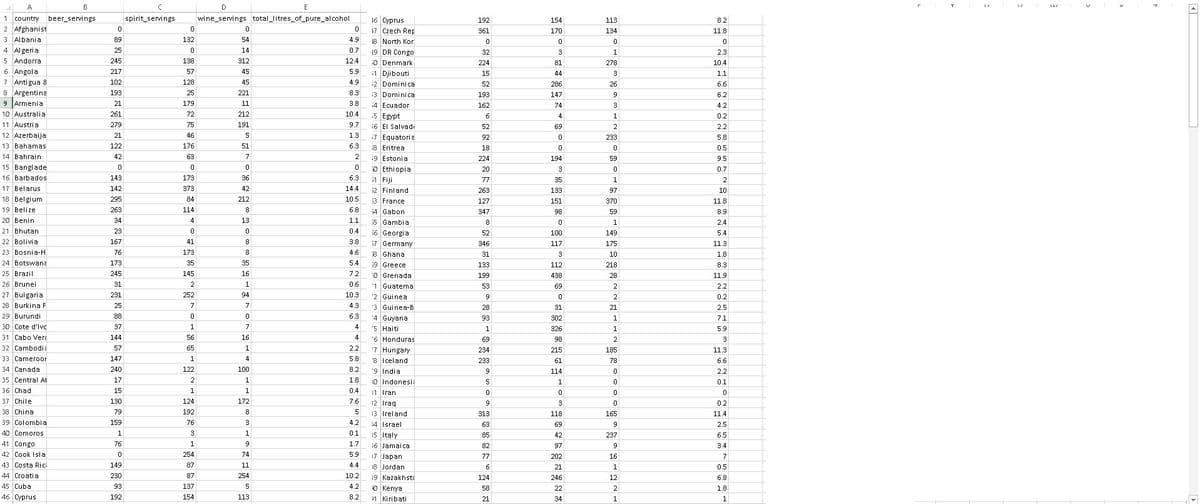
Transcribed Image Text:B
D
E
1 country beer_servings
spirit_servings
wine_servings total_litres_of_pure_alcohol
16 Cyprus
17 Czech Rep
18 North Kor
19 DR Congo
192
154
113
8.2
2 Afghanist
3 Albania
361
170
134
11.8
89
132
54
4.9
4 Al geria
25
14
0.7
32
3
2.3
5 Andorra
6 Angola
7 Anti gua 8
8 Argentina
9 Armenia
245
138
312
12.4
io Denmark
i1 Djibouti
i2 Dominica
13 Dominica
224
81
278
10.4
217
57
45
5.9
15
44
3
1.1
102
128
45
4.9
52
286
26
6.6
193
25
221
8.3
193
147
6.2
21
179
11
3.8
14 Ecuador
162
74
3
4.2
10 Australia
261
72
212
10.4
i5 Egypt
6
4
1
0.2
11 Austria
279
75
191
9.7
16 El Salvadi
52
69
2
2.2
12 Azerbaija
21
46
1.3
i7 Equatoria
92
233
5.8
13 Bahamas
122
176
51
6.3
i8 Eritrea
i9 Estonia
0 Ethiopia
18
0.5
14 Bahrain
42
63
2
224
194
59
9.5
15 Banglade
20
3
0.7
16 Barbados
143
173
36
6.3
51
Fiji
77
35
1
2
17 Belarus
142
373
42
14.4
52 Finland
263
133
97
10
18 Belgium
295
84
212
10.5
3 France
127
151
370
11.8
19 Belize
4 Gabon
55 Gambia
56 Georgia
57 Germany
3 Ghana
19 Greece
263
114
8
6.8
347
98
59
8.9
20 Benin
34
4
13
1.1
8
1
2.4
21 Bhutan
23
0.4
52
100
149
5.4
22 Bolivia
23 Bosnia-H
167
41
8
3.8
346
117
175
11.3
76
173
8
4.6
31
3
10
1.8
24 Botswana
173
35
35
5.4
133
112
218
8.3
25 Brazil
245
145
16
7.2
'o Grenada
'1 Guatema
'2 Guinea
'3 Guinea-B
199
438
28
11.9
26 Brunei
31
2
1
0.6
53
69
2.2
27 Bulgaria
231
252
94
10.3
2
0.2
28 Burkina F
25
7
7
4.3
28
31
21
2.5
29 Burundi
88
6.3
'4 Guyana
'5 Haiti
93
302
1
7.1
30 Cote d'Ivc
37
1
7
4
326
1
5.9
31 Cabo Vero
32 Cambodia
33 Cameroor
'6 Honduras
'7 Hungary
144
56
16
4
69
98
2
3
57
65
1
2.2
234
215
185
11.3
147
1
4
5.8
'8 Iceland
233
61
78
6.6
34
Canada
240
122
100
8.2
'9 India
114
2.2
35 Central At
17
2
1
1.8
10 Indonesi:
5
1
0.1
36 Chad
37 Chile
15
1
1
0.4
i1 Iran
:2 Iraq
130
124
172
7.6
9.
0.2
38 China
79
192
8
13 Ireland
313
118
165
11.4
39 Colombia
159
76
3
4.2
14 Israel
63
69
9
2.5
40 Comoros
41 Congo
1
3
1
0.1
15 Italy
85
42
237
6.5
76
1
1.7
16 Jamaica
82
97
3.4
42 Cook Isla
254
74
5.9
77
17 Japan
8 Jordan
202
16
7
43 Costa Rica
149
87
11
4.4
6
21
1
0.5
44 Croatia
230
87
254
10.2
19 Kazakhsta
0 Kenya
124
246
12
6.8
45 Cuba
93
137
4.2
58
22
2
1.8
46 Cyprus
192
154
113
8.2
1 Kiribati
21
34
1.
1
Expert Solution
This question has been solved!
Explore an expertly crafted, step-by-step solution for a thorough understanding of key concepts.

Step by step
Solved in 3 steps with 4 images

Recommended textbooks for you
MATLAB: An Introduction with Applications
Statistics
ISBN:
9781119256830
Author:
Amos Gilat
Publisher:
John Wiley & Sons Inc

Probability and Statistics for Engineering and th…
Statistics
ISBN:
9781305251809
Author:
Jay L. Devore
Publisher:
Cengage Learning

Statistics for The Behavioral Sciences (MindTap C…
Statistics
ISBN:
9781305504912
Author:
Frederick J Gravetter, Larry B. Wallnau
Publisher:
Cengage Learning
MATLAB: An Introduction with Applications
Statistics
ISBN:
9781119256830
Author:
Amos Gilat
Publisher:
John Wiley & Sons Inc
Probability and Statistics for Engineering and th…
Statistics
ISBN:
9781305251809
Author:
Jay L. Devore
Publisher:
Cengage Learning
Statistics for The Behavioral Sciences (MindTap C…
Statistics
ISBN:
9781305504912
Author:
Frederick J Gravetter, Larry B. Wallnau
Publisher:
Cengage Learning

Elementary Statistics: Picturing the World (7th E…
Statistics
ISBN:
9780134683416
Author:
Ron Larson, Betsy Farber
Publisher:
PEARSON

The Basic Practice of Statistics
Statistics
ISBN:
9781319042578
Author:
David S. Moore, William I. Notz, Michael A. Fligner
Publisher:
W. H. Freeman

Introduction to the Practice of Statistics
Statistics
ISBN:
9781319013387
Author:
David S. Moore, George P. McCabe, Bruce A. Craig
Publisher:
W. H. Freeman