Calculate the missing value ** and use tables to approximate the value of ***. Using a 1% level of significance, state the decision criteria for this test State the conclusion for the test and why
Calculate the missing value ** and use tables to approximate the value of ***. Using a 1% level of significance, state the decision criteria for this test State the conclusion for the test and why

MATLAB: An Introduction with Applications
6th Edition
ISBN:9781119256830
Author:Amos Gilat
Publisher:Amos Gilat
Chapter1: Starting With Matlab
Section: Chapter Questions
Problem 1P

Related questions
Question
-
Calculate the missing value ** and use tables to approximate the value of ***.
-
Using a 1% level of significance, state the decision criteria for this test
-
State the conclusion for the test and why
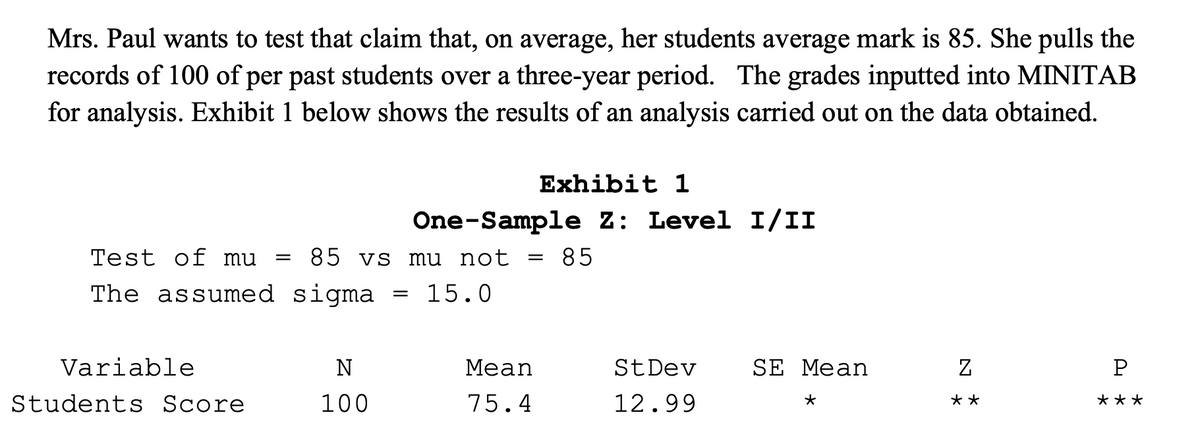
Transcribed Image Text:Mrs. Paul wants to test that claim that, on average, her students average mark is 85. She pulls the
records of 100 of per past students over a three-year period. The grades inputted into MINITAB
for analysis. Exhibit 1 below shows the results of an analysis carried out on the data obtained.
Exhibit 1
One-Sample Z: Level I/II
Test of mu
85 vs mu not
85
The assumed sigma = 15.0
Variable
N
Мean
StDev
SE Mean
P
Students Score
100
75.4
12.99
**
***
Expert Solution
This question has been solved!
Explore an expertly crafted, step-by-step solution for a thorough understanding of key concepts.

Step by step
Solved in 4 steps

Recommended textbooks for you
MATLAB: An Introduction with Applications
Statistics
ISBN:
9781119256830
Author:
Amos Gilat
Publisher:
John Wiley & Sons Inc

Probability and Statistics for Engineering and th…
Statistics
ISBN:
9781305251809
Author:
Jay L. Devore
Publisher:
Cengage Learning

Statistics for The Behavioral Sciences (MindTap C…
Statistics
ISBN:
9781305504912
Author:
Frederick J Gravetter, Larry B. Wallnau
Publisher:
Cengage Learning
MATLAB: An Introduction with Applications
Statistics
ISBN:
9781119256830
Author:
Amos Gilat
Publisher:
John Wiley & Sons Inc
Probability and Statistics for Engineering and th…
Statistics
ISBN:
9781305251809
Author:
Jay L. Devore
Publisher:
Cengage Learning
Statistics for The Behavioral Sciences (MindTap C…
Statistics
ISBN:
9781305504912
Author:
Frederick J Gravetter, Larry B. Wallnau
Publisher:
Cengage Learning

Elementary Statistics: Picturing the World (7th E…
Statistics
ISBN:
9780134683416
Author:
Ron Larson, Betsy Farber
Publisher:
PEARSON

The Basic Practice of Statistics
Statistics
ISBN:
9781319042578
Author:
David S. Moore, William I. Notz, Michael A. Fligner
Publisher:
W. H. Freeman

Introduction to the Practice of Statistics
Statistics
ISBN:
9781319013387
Author:
David S. Moore, George P. McCabe, Bruce A. Craig
Publisher:
W. H. Freeman