Calculate the Standard deviation of the grouped data shown in the frequency table below: Classes frequency 50 – 59 3 60 – 69 5 70 – 79 9 80 – 89 12 90 – 99 8
Calculate the Standard deviation of the grouped data shown in the frequency table below: Classes frequency 50 – 59 3 60 – 69 5 70 – 79 9 80 – 89 12 90 – 99 8

Glencoe Algebra 1, Student Edition, 9780079039897, 0079039898, 2018
18th Edition
ISBN:9780079039897
Author:Carter
Publisher:Carter
Chapter10: Statistics
Section10.5: Comparing Sets Of Data
Problem 13PPS

Related questions
Question
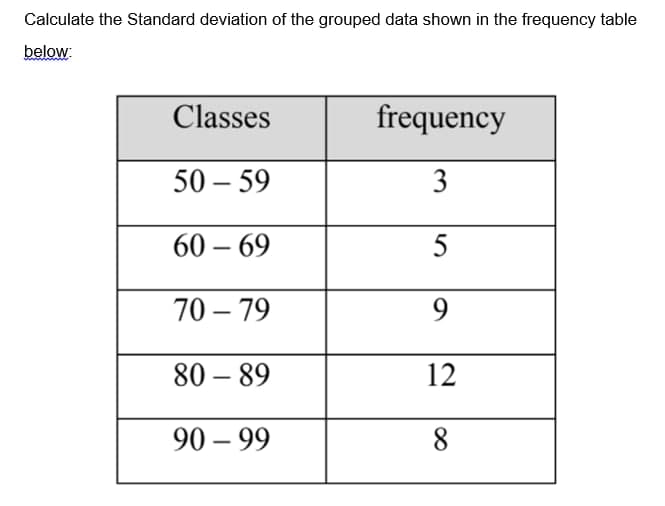
Transcribed Image Text:Calculate the Standard deviation of the grouped data shown in the frequency table
below:
Classes
frequency
50 – 59
3
60 – 69
5
70 – 79
9
80 – 89
12
-
90 – 99
8
Expert Solution
This question has been solved!
Explore an expertly crafted, step-by-step solution for a thorough understanding of key concepts.

This is a popular solution!

Trending now
This is a popular solution!

Step by step
Solved in 2 steps with 1 images

Recommended textbooks for you
Glencoe Algebra 1, Student Edition, 9780079039897…
Algebra
ISBN:
9780079039897
Author:
Carter
Publisher:
McGraw Hill

Mathematics For Machine Technology
Advanced Math
ISBN:
9781337798310
Author:
Peterson, John.
Publisher:
Cengage Learning,
Glencoe Algebra 1, Student Edition, 9780079039897…
Algebra
ISBN:
9780079039897
Author:
Carter
Publisher:
McGraw Hill
Mathematics For Machine Technology
Advanced Math
ISBN:
9781337798310
Author:
Peterson, John.
Publisher:
Cengage Learning,