Calculate the test statistic. (X^2)Enter your answer rounded to three decimal places

Glencoe Algebra 1, Student Edition, 9780079039897, 0079039898, 2018
18th Edition
ISBN:9780079039897
Author:Carter
Publisher:Carter
Chapter10: Statistics
Section10.3: Measures Of Spread
Problem 8PPS

Related questions
Topic Video
Question
Calculate the test statistic. (X^2)Enter your answer rounded to three decimal places.
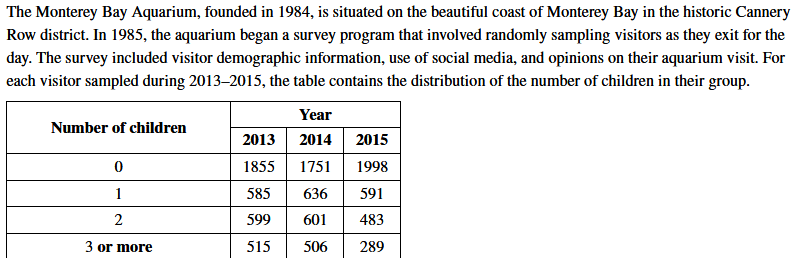
Transcribed Image Text:The Monterey Bay Aquarium, founded in 1984, is situated on the beautiful coast of Monterey Bay in the historic Cannery
Row district. In 1985, the aquarium began a survey program that involved randomly sampling visitors as they exit for the
day. The survey included visitor demographic information, use of social media, and opinions on their aquarium visit. For
each visitor sampled during 2013-2015, the table contains the distribution of the number of children in their group.
Year
Number of children
2013
2014 2015
1855
1751
1998
1
585
636
591
2
599
601
483
3 or more
515
506
289
Expert Solution
Step 1
From provided information, the aquarium began a survey program that involved randomly sampling visitors as they exit for the day. For each sampled during 2013-2015, the table for distribution of numbers of children in their group is:
|
Number of |
|
|
|
|
Children |
2013 |
2014 |
2015 |
|
0 |
1855 |
1751 |
1998 |
|
1 |
585 |
636 |
591 |
|
2 |
599 |
601 |
483 |
|
3 or more |
515 |
506 |
289 |
The chi-square test statistic can be calculated as:
Where, oi is observed frequency and ei is expected frequency
ei can be calculated as:

Step by step
Solved in 2 steps

Knowledge Booster


Learn more about
Need a deep-dive on the concept behind this application? Look no further. Learn more about this topic, statistics and related others by exploring similar questions and additional content below.Recommended textbooks for you
Glencoe Algebra 1, Student Edition, 9780079039897…
Algebra
ISBN:
9780079039897
Author:
Carter
Publisher:
McGraw Hill

Holt Mcdougal Larson Pre-algebra: Student Edition…
Algebra
ISBN:
9780547587776
Author:
HOLT MCDOUGAL
Publisher:
HOLT MCDOUGAL

Big Ideas Math A Bridge To Success Algebra 1: Stu…
Algebra
ISBN:
9781680331141
Author:
HOUGHTON MIFFLIN HARCOURT
Publisher:
Houghton Mifflin Harcourt
Glencoe Algebra 1, Student Edition, 9780079039897…
Algebra
ISBN:
9780079039897
Author:
Carter
Publisher:
McGraw Hill
Holt Mcdougal Larson Pre-algebra: Student Edition…
Algebra
ISBN:
9780547587776
Author:
HOLT MCDOUGAL
Publisher:
HOLT MCDOUGAL
Big Ideas Math A Bridge To Success Algebra 1: Stu…
Algebra
ISBN:
9781680331141
Author:
HOUGHTON MIFFLIN HARCOURT
Publisher:
Houghton Mifflin Harcourt