The graph shows the depth of water W in a reservoir over a'one-year period as a function of the number of days x since the beginning of the year. What was the average rate of change of W between x = 150 and x = 300? (Assume that the points lie on the grid lines.) %3D W (ft) 250 225 175 150 125 001 75¢ 25 + x (days) 50 100 150 200 250 300 350 400 day/ft Interpret the average rate of change in the context of the question. The water depth did not change during that time span. O The water depth increased and decreased the same amount during that time span. The water depth is changing by this amount in feet each day. It takes this many days for the water depth to change by one foot. O The date did not change while the depth of water did change. 2 114 F8 F2 F3 F4 F5 F6 F10 & #3 % 14
The graph shows the depth of water W in a reservoir over a'one-year period as a function of the number of days x since the beginning of the year. What was the average rate of change of W between x = 150 and x = 300? (Assume that the points lie on the grid lines.) %3D W (ft) 250 225 175 150 125 001 75¢ 25 + x (days) 50 100 150 200 250 300 350 400 day/ft Interpret the average rate of change in the context of the question. The water depth did not change during that time span. O The water depth increased and decreased the same amount during that time span. The water depth is changing by this amount in feet each day. It takes this many days for the water depth to change by one foot. O The date did not change while the depth of water did change. 2 114 F8 F2 F3 F4 F5 F6 F10 & #3 % 14

Big Ideas Math A Bridge To Success Algebra 1: Student Edition 2015
1st Edition
ISBN:9781680331141
Author:HOUGHTON MIFFLIN HARCOURT
Publisher:HOUGHTON MIFFLIN HARCOURT
Chapter10: Radical Functions And Equations
Section: Chapter Questions
Problem 15CT

Related questions
Question
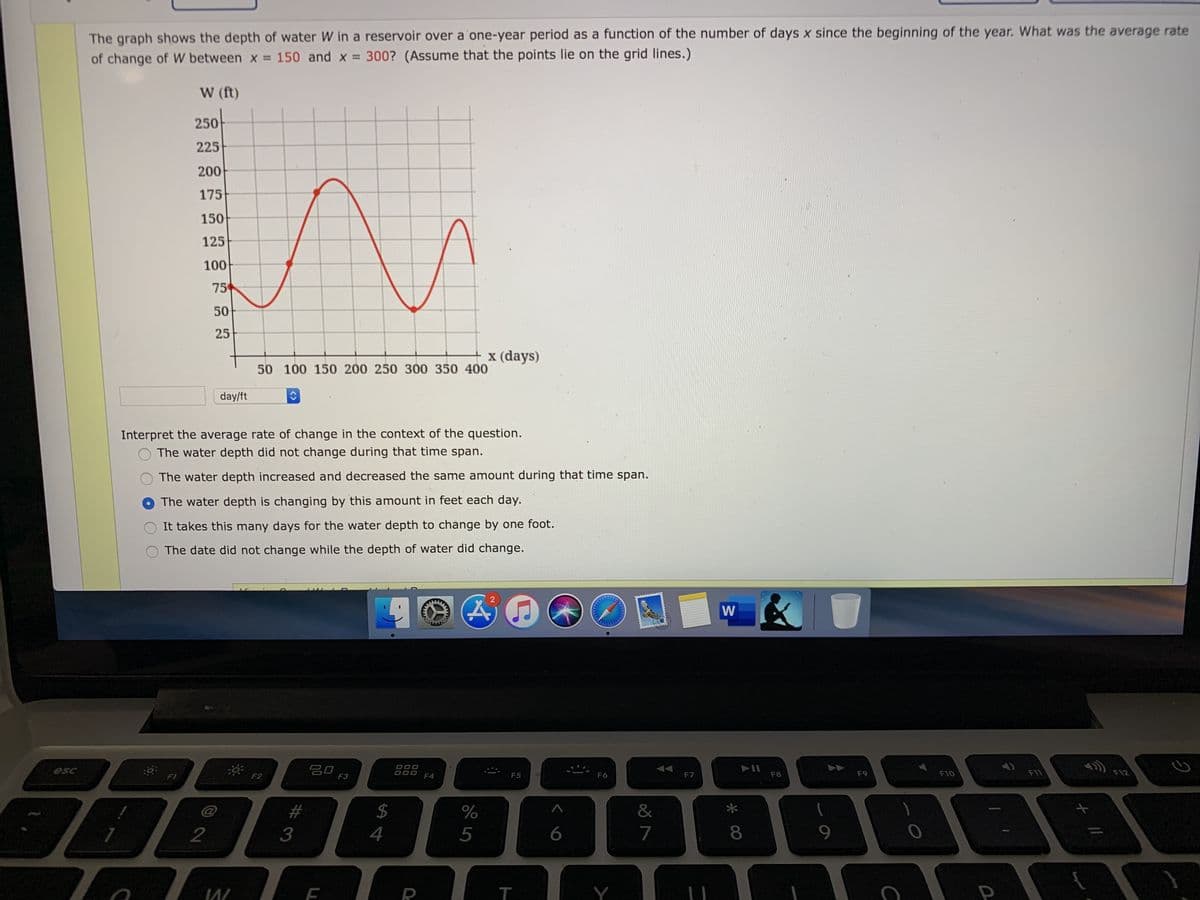
Transcribed Image Text:The graph shows the depth of water W in a reservoir over a'one-year period as a function of the number of days x since the beginning of the year. What was the average rate
of change of W between x = 150 and x = 300? (Assume that the points lie on the grid lines.)
%3D
W (ft)
250
225
175
150
125
001
75¢
25
+ x (days)
50 100 150 200 250 300 350 400
day/ft
Interpret the average rate of change in the context of the question.
The water depth did not change during that time span.
O The water depth increased and decreased the same amount during that time span.
The water depth is changing by this amount in feet each day.
It takes this many days for the water depth to change by one foot.
O The date did not change while the depth of water did change.
2
114
F8
F2
F3
F4
F5
F6
F10
&
#3
%
14
Expert Solution
This question has been solved!
Explore an expertly crafted, step-by-step solution for a thorough understanding of key concepts.

This is a popular solution!

Trending now
This is a popular solution!

Step by step
Solved in 2 steps with 1 images

Recommended textbooks for you
Big Ideas Math A Bridge To Success Algebra 1: Stu…
Algebra
ISBN:
9781680331141
Author:
HOUGHTON MIFFLIN HARCOURT
Publisher:
Houghton Mifflin Harcourt

College Algebra
Algebra
ISBN:
9781305115545
Author:
James Stewart, Lothar Redlin, Saleem Watson
Publisher:
Cengage Learning

Functions and Change: A Modeling Approach to Coll…
Algebra
ISBN:
9781337111348
Author:
Bruce Crauder, Benny Evans, Alan Noell
Publisher:
Cengage Learning
Big Ideas Math A Bridge To Success Algebra 1: Stu…
Algebra
ISBN:
9781680331141
Author:
HOUGHTON MIFFLIN HARCOURT
Publisher:
Houghton Mifflin Harcourt
College Algebra
Algebra
ISBN:
9781305115545
Author:
James Stewart, Lothar Redlin, Saleem Watson
Publisher:
Cengage Learning
Functions and Change: A Modeling Approach to Coll…
Algebra
ISBN:
9781337111348
Author:
Bruce Crauder, Benny Evans, Alan Noell
Publisher:
Cengage Learning

Algebra and Trigonometry (MindTap Course List)
Algebra
ISBN:
9781305071742
Author:
James Stewart, Lothar Redlin, Saleem Watson
Publisher:
Cengage Learning


Mathematics For Machine Technology
Advanced Math
ISBN:
9781337798310
Author:
Peterson, John.
Publisher:
Cengage Learning,