Camplete all missing valucs in table below: Labor Output Fixed Variable Total Average Average Average Marginal cost cost cost fixed variable total cost cost CAOST cost $60 1. 1 $60 70$ 2. 6. $60 $140 3. 11 $60 $210 4 15 $60 280S 13 $60 $350 6. 12 $60 $120 1. Draw the short run total cost curve (show the total cost; fixed cost, variable cost).
Camplete all missing valucs in table below: Labor Output Fixed Variable Total Average Average Average Marginal cost cost cost fixed variable total cost cost CAOST cost $60 1. 1 $60 70$ 2. 6. $60 $140 3. 11 $60 $210 4 15 $60 280S 13 $60 $350 6. 12 $60 $120 1. Draw the short run total cost curve (show the total cost; fixed cost, variable cost).

Principles of Economics 2e
2nd Edition
ISBN:9781947172364
Author:Steven A. Greenlaw; David Shapiro
Publisher:Steven A. Greenlaw; David Shapiro
Chapter7: Production, Costs, And Industry Structure
Section: Chapter Questions
Problem 11RQ: What is die difference between accounting and economic profit?

Related questions
Question
100%
Transcribed Image Text:CON101-Assignment-2 (1) - Protected View - Saved to this PC -
P Search
ut
References
Mailings
Review
view
Help
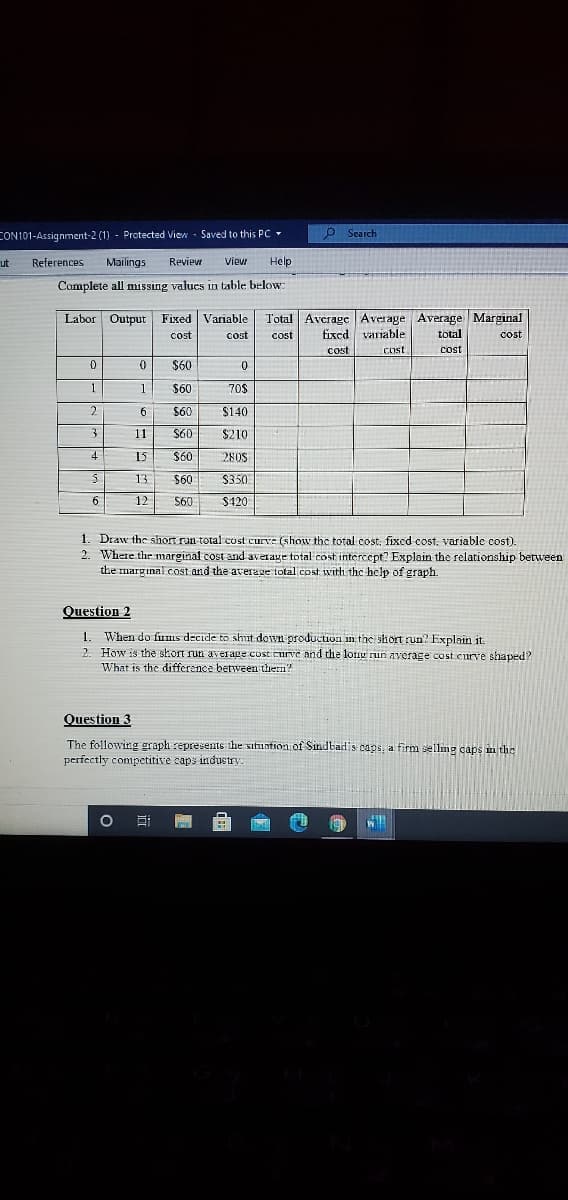
Camplete all missıng valucs in table below:
Total Average Average Average Marginal
fixed variable
Labor Output Fixed Variable
cost
cost
cost
total
cost
cost
cost
$60
1
1
$60
70$
2.
9.
$60
$140
11
$60
$210
4
15
$60
280S
13
$60
$350
6
12
$60
$420
1. Draw thc short run total cost curve (show the total cost, fixed cost, variable cost).
2. Where the marginal cost and averaye total cost intercept? Explain the relationship between
the marginal cost and the average total cost with the help of graph.
Question 2
1. When do fums decide to shut down production in the short run? Explain it.
2. How is the short run average cust curve and the long run average cost curve shaped?
What is the difference between them?
Question 3
The following graph represents the situntion of Sindbadis caps, a firm selling caps in the
perfectly competitive caps industry
Expert Solution
This question has been solved!
Explore an expertly crafted, step-by-step solution for a thorough understanding of key concepts.

Step by step
Solved in 2 steps with 1 images

Knowledge Booster


Learn more about
Need a deep-dive on the concept behind this application? Look no further. Learn more about this topic, economics and related others by exploring similar questions and additional content below.Recommended textbooks for you
Principles of Economics 2e
Economics
ISBN:
9781947172364
Author:
Steven A. Greenlaw; David Shapiro
Publisher:
OpenStax
Principles of Economics 2e
Economics
ISBN:
9781947172364
Author:
Steven A. Greenlaw; David Shapiro
Publisher:
OpenStax