can anyone explain how the graph is correlated to the p-value and if there is a difference between reflex times between each group member?
can anyone explain how the graph is correlated to the p-value and if there is a difference between reflex times between each group member?

Algebra & Trigonometry with Analytic Geometry
13th Edition
ISBN:9781133382119
Author:Swokowski
Publisher:Swokowski
Chapter9: Systems Of Equations And Inequalities
Section9.1: Systems Of Equations
Problem 44E

Related questions
Question
can anyone explain how the graph is
Transcribed Image Text:Results
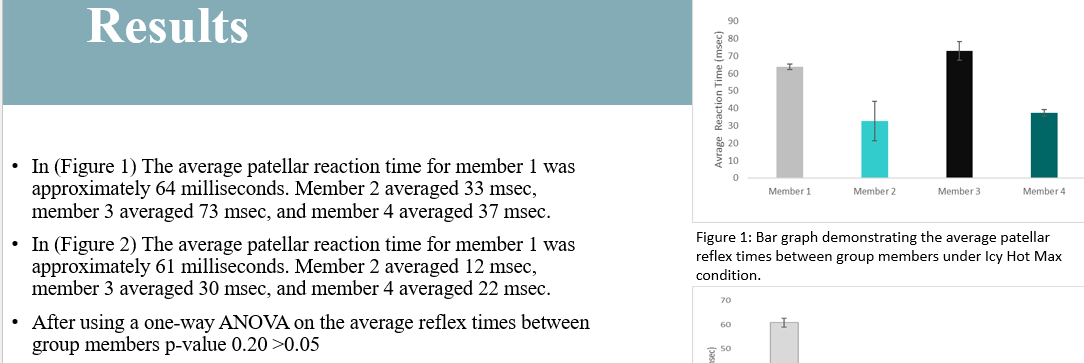
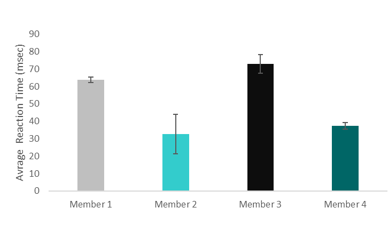
• In (Figure 1) The average patellar reaction time for member 1 was
approximately 64 milliseconds. Member 2 averaged 33 msec,
member 3 averaged 73 msec, and member 4 averaged 37 msec.
• In (Figure 2) The average patellar reaction time for member 1 was
approximately 61 milliseconds. Member 2 averaged 12 msec,
member 3 averaged 30 msec, and member 4 averaged 22 msec.
• After using a one-way ANOVA on the average reflex times between
group members p-value 0.20 >0.05
Avrage Reaction Time (msec)
2 8 28 9 AY
90
80
70
60
0
50
Member 1
Member 2
Figure 1: Bar graph demonstrating the average patellar
reflex times between group members under Icy Hot Max
condition.
Member 3
Member 4
Transcribed Image Text:Avrage Reaction Time (msec)
H
Member 1
Member 2
Member 3
Member 4
Expert Solution
This question has been solved!
Explore an expertly crafted, step-by-step solution for a thorough understanding of key concepts.

This is a popular solution!

Trending now
This is a popular solution!

Step by step
Solved in 3 steps with 2 images

Recommended textbooks for you
Algebra & Trigonometry with Analytic Geometry
Algebra
ISBN:
9781133382119
Author:
Swokowski
Publisher:
Cengage


Elementary Algebra
Algebra
ISBN:
9780998625713
Author:
Lynn Marecek, MaryAnne Anthony-Smith
Publisher:
OpenStax - Rice University
Algebra & Trigonometry with Analytic Geometry
Algebra
ISBN:
9781133382119
Author:
Swokowski
Publisher:
Cengage
Elementary Algebra
Algebra
ISBN:
9780998625713
Author:
Lynn Marecek, MaryAnne Anthony-Smith
Publisher:
OpenStax - Rice University

Algebra and Trigonometry (MindTap Course List)
Algebra
ISBN:
9781305071742
Author:
James Stewart, Lothar Redlin, Saleem Watson
Publisher:
Cengage Learning