The following data are the joint temperatures of the O-rings (°F) for each test firing or actual launch of the space shuttle rocket motor (from Presidential Commission on the Space Shuttle Challenger Accident, Vol. 1, pp. 129-131): 83 48 61 40 83 67 45 66 70 69 80 58 68 60 67 72 73 70 57 63 70 78 52 67 53 67 75 Round your answers to 2 decimal places (e.g. 98.76). (a) Using the entire data, calculate the sample mean and sample standard deviation. Sample mean- Sample standard deviation = (b) Remove the smallest observation (31°F) and calculate the sample mean and sample standard deviation of the remaining data. Sample mean = i Sample standard deviation- (c) With the smallest observation removed: the sample mean and the sample standard deviation Statistical Tables and Charts
The following data are the joint temperatures of the O-rings (°F) for each test firing or actual launch of the space shuttle rocket motor (from Presidential Commission on the Space Shuttle Challenger Accident, Vol. 1, pp. 129-131): 83 48 61 40 83 67 45 66 70 69 80 58 68 60 67 72 73 70 57 63 70 78 52 67 53 67 75 Round your answers to 2 decimal places (e.g. 98.76). (a) Using the entire data, calculate the sample mean and sample standard deviation. Sample mean- Sample standard deviation = (b) Remove the smallest observation (31°F) and calculate the sample mean and sample standard deviation of the remaining data. Sample mean = i Sample standard deviation- (c) With the smallest observation removed: the sample mean and the sample standard deviation Statistical Tables and Charts

Glencoe Algebra 1, Student Edition, 9780079039897, 0079039898, 2018
18th Edition
ISBN:9780079039897
Author:Carter
Publisher:Carter
Chapter10: Statistics
Section10.1: Measures Of Center
Problem 9PPS

Related questions
Question
100%
6.1-2 3 help with 5 part question
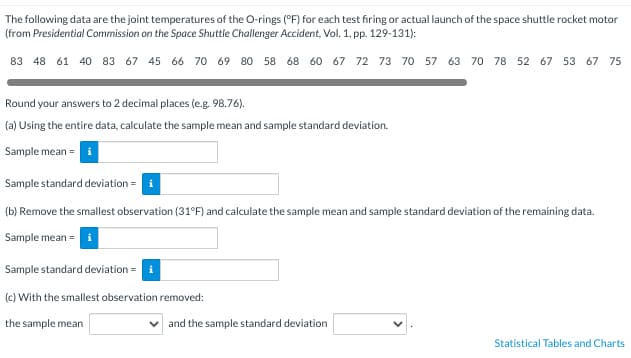
Transcribed Image Text:The following data are the joint temperatures of the O-rings (°F) for each test firing or actual launch of the space shuttle rocket motor
(from Presidential Commission on the Space Shuttle Challenger Accident, Vol. 1, pp. 129-131):
83 48 61 40 83 67 45 66 70 69 80 58 68 60 67 72 73 70 57 63 70 78 52 67 53 67 75
Round your answers to 2 decimal places (e.g. 98.76).
(a) Using the entire data, calculate the sample mean and sample standard deviation.
Sample mean =
Sample standard deviation = i
(b) Remove the smallest observation (31°F) and calculate the sample mean and sample standard deviation of the remaining data.
Sample mean =
Sample standard deviation - i
(c) With the smallest observation removed:
the sample mean
and the sample standard deviation
Statistical Tables and Charts
Expert Solution
This question has been solved!
Explore an expertly crafted, step-by-step solution for a thorough understanding of key concepts.

Step by step
Solved in 5 steps

Recommended textbooks for you
Glencoe Algebra 1, Student Edition, 9780079039897…
Algebra
ISBN:
9780079039897
Author:
Carter
Publisher:
McGraw Hill
Glencoe Algebra 1, Student Edition, 9780079039897…
Algebra
ISBN:
9780079039897
Author:
Carter
Publisher:
McGraw Hill