What is the value of the test statistic, F?

Mathematics For Machine Technology
8th Edition
ISBN:9781337798310
Author:Peterson, John.
Publisher:Peterson, John.
Chapter29: Tolerance, Clearance, And Interference
Section: Chapter Questions
Problem 16A: Spacers are manufactured to the mean dimension and tolerance shown in Figure 29-12. An inspector...

Related questions
Question
Q39
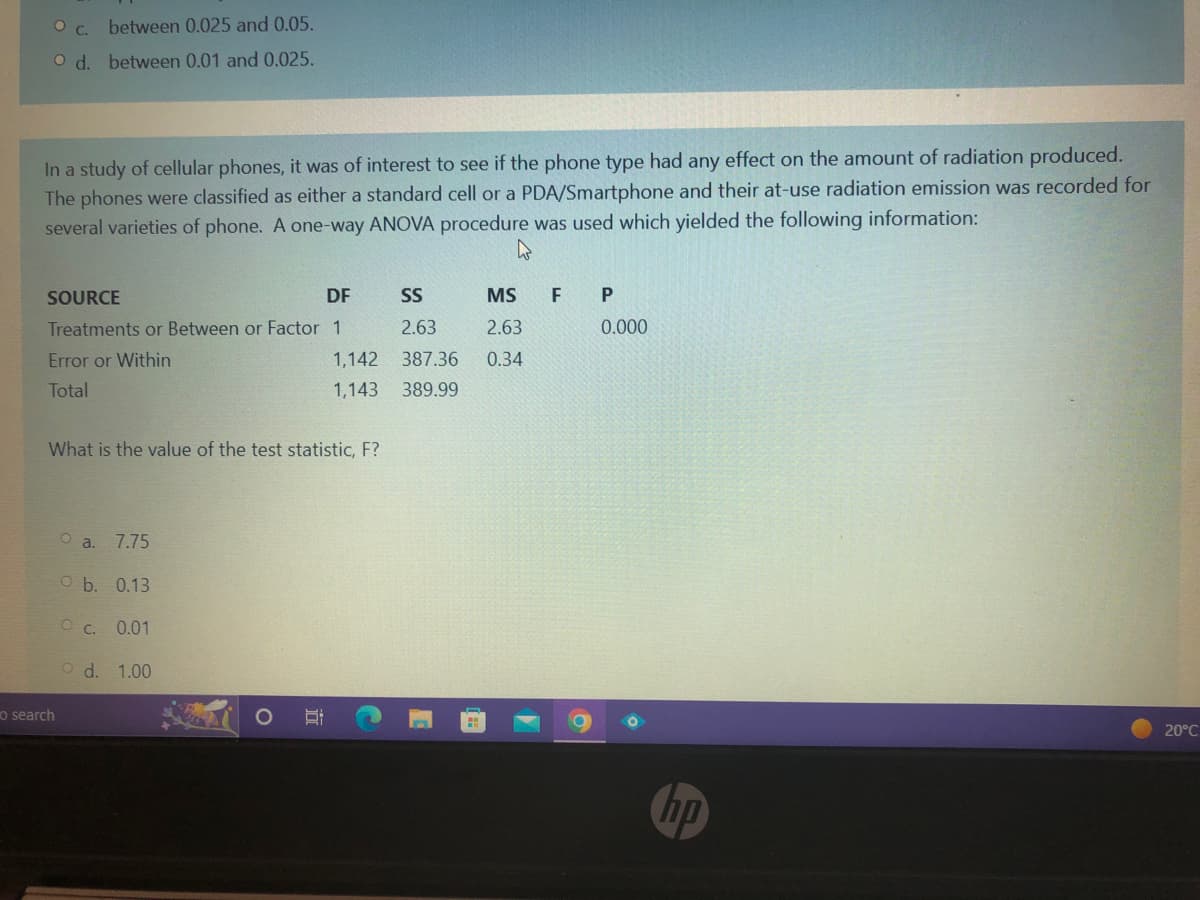
Transcribed Image Text:0 с.
between 0.025 and 0.05.
O d. between 0.01 and 0.025.
In a study of cellular phones, it was of interest to see if the phone type had any effect on the amount of radiation produced.
The phones were classified as either a standard cell or a PDA/Smartphone and their at-use radiation emission was recorded for
several varieties of phone. A one-way ANOVA procedure was used which yielded the following information:
SOURCE
DF
Treatments or Between or Factor 1
Error or Within
Total
What is the value of the test statistic, F?
O search
O a. 7.75
O b. 0.13
OC. 0.01
Od. 1.00
SS
2.63 2.63
1,142 387.36 0.34
1,143 389.99
21
MS F P
0.000
hp
20°C
Expert Solution
This question has been solved!
Explore an expertly crafted, step-by-step solution for a thorough understanding of key concepts.

Step by step
Solved in 2 steps with 2 images

Recommended textbooks for you
Mathematics For Machine Technology
Advanced Math
ISBN:
9781337798310
Author:
Peterson, John.
Publisher:
Cengage Learning,
Mathematics For Machine Technology
Advanced Math
ISBN:
9781337798310
Author:
Peterson, John.
Publisher:
Cengage Learning,