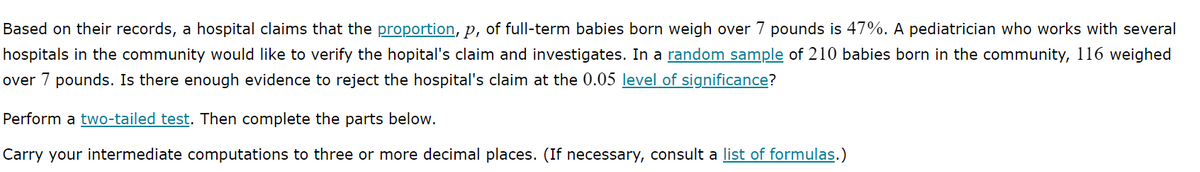
The General Social Survey is an annual survey given to about 1500 U.S. adults selected at random. A recent survey contained the question "How important to your life is having a fulfilling job?" Of the 267 college graduates surveyed, 106 chose the response "Very important." Of the 113 people surveyed whose highest level of education was high school or less, 59 chose the response "Very important." Based on these data, can we conclude, at the 0.05 level of significance, that there is a difference between the proportion p1 of all U.S. college graduates who would answer "Very important" and the proportion p2 of all U.S. adults whose highest level of education was high school or less who would answer "Very important"?Perform a two-tailed test. Then complete the parts below.Carry your intermediate computations to three or more decimal places and round your answers as specified in the parts below. (If necessary, consult a list of formulas.) A. Find the value of the test statistic and round to 3 or more decimal places. (I have posted a picture of an example problem and the equation to use, with the correct answer as every expert I have asked thus far has gotten this problem wrong.) B. Find the two critical values at the 0.05 level of significance. (Round to three or more decimal places.) C.


The General Social Survey is an annual survey given to about 1500 U.S. adults selected at random. A recent survey contained the question "How important to your life is having a fulfilling job?" Of the 267 college graduates surveyed, 106 chose the response "Very important." Of the 113 people surveyed whose highest level of education was high school or less, 59 chose the response "Very important." Based on these data, can we conclude, at the 0.05 level of significance, that there is a difference between the proportion p1 of all U.S. college graduates who would answer "Very important" and the proportion p2 of all U.S. adults whose highest level of education was high school or less who would answer "Very important"?Perform a two-tailed test. Then complete the parts below.Carry your intermediate computations to three or more decimal places and round your answers as specified in the parts below. (If necessary, consult a list of formulas.)
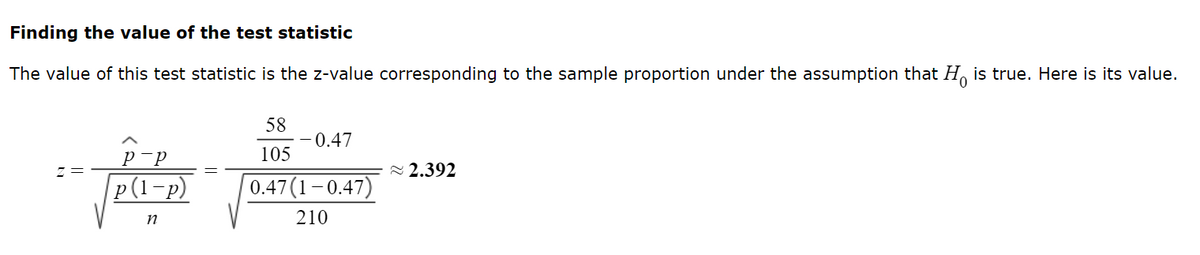
A. Find the value of the test statistic and round to 3 or more decimal places. (I have posted a picture of an example problem and the equation to use, with the correct answer as every expert I have asked thus far has gotten this problem wrong.)
B. Find the two critical values at the 0.05 level of significance. (Round to three or more decimal places.)
C.


Trending now
This is a popular solution!

Step by step
Solved in 5 steps with 3 images

Can you round the critical values to 3 or more decimal points?