Consider the following information about the various states of economy and the returns of various investment alternatives for each scenario. Answer the questions that follow. State of the Economy Recession Below Average Average Above Average Boom Mean Standard Deviation Coefficient of Variation Covariance with MP Probability 0.2 0.1 0.3 0.3 0.1 % Return on T-Bills, Stocks and Market Index Pay-Rubber- T- Bills 7 7 7 7 7 Phillips -22 -2 20 35 50 up 28 14.7 0 -10 -20 made 10 -10 7 45 30 Market Index -13 1 15 29 43
Consider the following information about the various states of economy and the returns of various investment alternatives for each scenario. Answer the questions that follow. State of the Economy Recession Below Average Average Above Average Boom Mean Standard Deviation Coefficient of Variation Covariance with MP Probability 0.2 0.1 0.3 0.3 0.1 % Return on T-Bills, Stocks and Market Index Pay-Rubber- T- Bills 7 7 7 7 7 Phillips -22 -2 20 35 50 up 28 14.7 0 -10 -20 made 10 -10 7 45 30 Market Index -13 1 15 29 43

Essentials of Business Analytics (MindTap Course List)
2nd Edition
ISBN:9781305627734
Author:Jeffrey D. Camm, James J. Cochran, Michael J. Fry, Jeffrey W. Ohlmann, David R. Anderson
Publisher:Jeffrey D. Camm, James J. Cochran, Michael J. Fry, Jeffrey W. Ohlmann, David R. Anderson
Chapter15: Decision Analysis
Section: Chapter Questions
Problem 4P: Investment advisors estimated the stock market returns for four market segments: computers,...

Related questions
Question
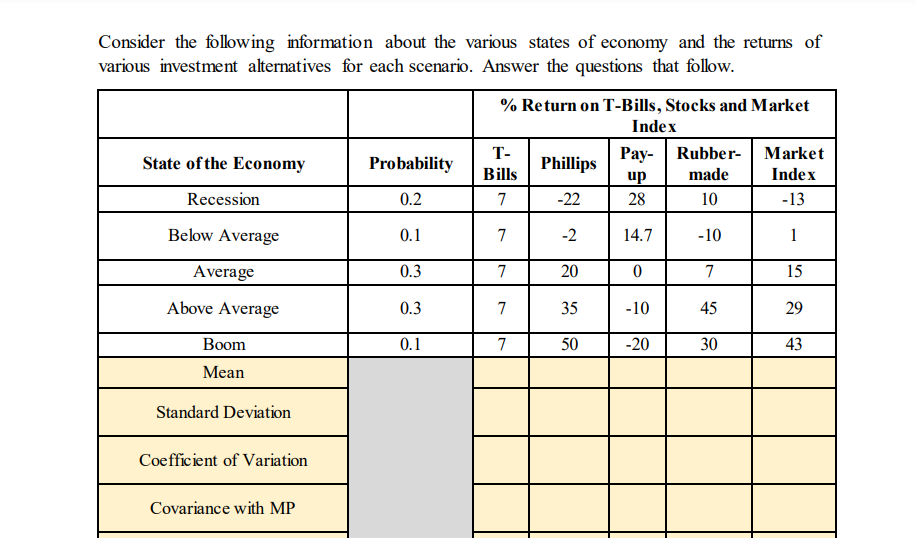
Transcribed Image Text:Consider the following information about the various states of economy and the returns of
various investment alternatives for each scenario. Answer the questions that follow.
State of the Economy
Recession
Below Average
Average
Above Average
Boom
Mean
Standard Deviation
Coefficient of Variation
Covariance with MP
Probability
0.2
0.1
0.3
0.3
0.1
% Return on T-Bills, Stocks and Market
Index
Pay-Rubber-
made
10
-10
7
45
30
T-
Bills
7
7
7
7
7
Phillips
-22
-2
20
35
50
up
28
14.7
0
-10
-20
Market
Index
-13
1
15
29
43
Expert Solution
This question has been solved!
Explore an expertly crafted, step-by-step solution for a thorough understanding of key concepts.

Step by step
Solved in 2 steps with 3 images

Follow-up Questions
Read through expert solutions to related follow-up questions below.
Follow-up Question
Can you provide a manual written working of calculating CAPM Req. Return and beta
Solution
Follow-up Question
Using the data generated in the previous question (Question 1)
- Plot the Security Market Line (SML)
- b) Superimpose the
CAPM’s required return on the SML - c) Indicate which investments will plot on, above and below the SML?
Solution
Follow-up Question
Can you show how to calculate the variance step by step without using excel
Solution
Follow-up Question
hello, New to this. why is the variance added to the table
Solution
Follow-up Question
Can you provide a manual written working of calculating covariance with MP? I am very much still confused.
Solution
Knowledge Booster


Learn more about
Need a deep-dive on the concept behind this application? Look no further. Learn more about this topic, finance and related others by exploring similar questions and additional content below.Recommended textbooks for you
Essentials of Business Analytics (MindTap Course …
Statistics
ISBN:
9781305627734
Author:
Jeffrey D. Camm, James J. Cochran, Michael J. Fry, Jeffrey W. Ohlmann, David R. Anderson
Publisher:
Cengage Learning


Intermediate Financial Management (MindTap Course…
Finance
ISBN:
9781337395083
Author:
Eugene F. Brigham, Phillip R. Daves
Publisher:
Cengage Learning
Essentials of Business Analytics (MindTap Course …
Statistics
ISBN:
9781305627734
Author:
Jeffrey D. Camm, James J. Cochran, Michael J. Fry, Jeffrey W. Ohlmann, David R. Anderson
Publisher:
Cengage Learning
Intermediate Financial Management (MindTap Course…
Finance
ISBN:
9781337395083
Author:
Eugene F. Brigham, Phillip R. Daves
Publisher:
Cengage Learning