Candom Inc. January-17 February-17 March-17 April-17 May-17 June-17 Suniden July-17 July-17 August-17 September-17 October 17 November-17 December-17 January-18 February-18 March-18 April 18 Cost data for the last 3 years Overhead Costs Units Produced $78,000 $91,000 $100,000 $78,000 $89,000 $93,000 $87,000 $94,000 $94,000 $81,000 $81,000 $85,000 $85,000 $104,500 $104,000 $92,000 $104,000 $96,000 $77.000 5,679 6,751 7,539 5,335 6,480 0,400 7,630 1,090 6,331 7,998 5,943 7,081 7,694 8,903 7,485 9,062 8,189 5.410 Use regression and show the equation used for Random to separate overhead into fixed and variable components. How much of the change in costs will this equation predict? What is the variable cost per unit for overhead? Round to the nearest cent What is the fixed overhead cost per month? Round to the nearest dollar Random analyzes their other costs and finds the following (in addition to the overhead costs above): Direct Mat Each unit of inventory uses 2 gallons of materials and each gallon costs $3 Direct Labor On average a worker can produce 16 units of product in an 8 hour shift and gets paid $180 for that shift Each month Random spends $26,500 on selling and administration costs Sales price for 2021 is estimated at $36 per unit What is the contribution margin per unit? Round to the nearest cent
Candom Inc. January-17 February-17 March-17 April-17 May-17 June-17 Suniden July-17 July-17 August-17 September-17 October 17 November-17 December-17 January-18 February-18 March-18 April 18 Cost data for the last 3 years Overhead Costs Units Produced $78,000 $91,000 $100,000 $78,000 $89,000 $93,000 $87,000 $94,000 $94,000 $81,000 $81,000 $85,000 $85,000 $104,500 $104,000 $92,000 $104,000 $96,000 $77.000 5,679 6,751 7,539 5,335 6,480 0,400 7,630 1,090 6,331 7,998 5,943 7,081 7,694 8,903 7,485 9,062 8,189 5.410 Use regression and show the equation used for Random to separate overhead into fixed and variable components. How much of the change in costs will this equation predict? What is the variable cost per unit for overhead? Round to the nearest cent What is the fixed overhead cost per month? Round to the nearest dollar Random analyzes their other costs and finds the following (in addition to the overhead costs above): Direct Mat Each unit of inventory uses 2 gallons of materials and each gallon costs $3 Direct Labor On average a worker can produce 16 units of product in an 8 hour shift and gets paid $180 for that shift Each month Random spends $26,500 on selling and administration costs Sales price for 2021 is estimated at $36 per unit What is the contribution margin per unit? Round to the nearest cent

Cornerstones of Cost Management (Cornerstones Series)
4th Edition
ISBN:9781305970663
Author:Don R. Hansen, Maryanne M. Mowen
Publisher:Don R. Hansen, Maryanne M. Mowen
Chapter3: Cost Behavior
Section: Chapter Questions
Problem 10E: SmokeCity, Inc., manufactures barbeque smokers. Based on past experience, SmokeCity has found that...

Related questions

Question
Second part here
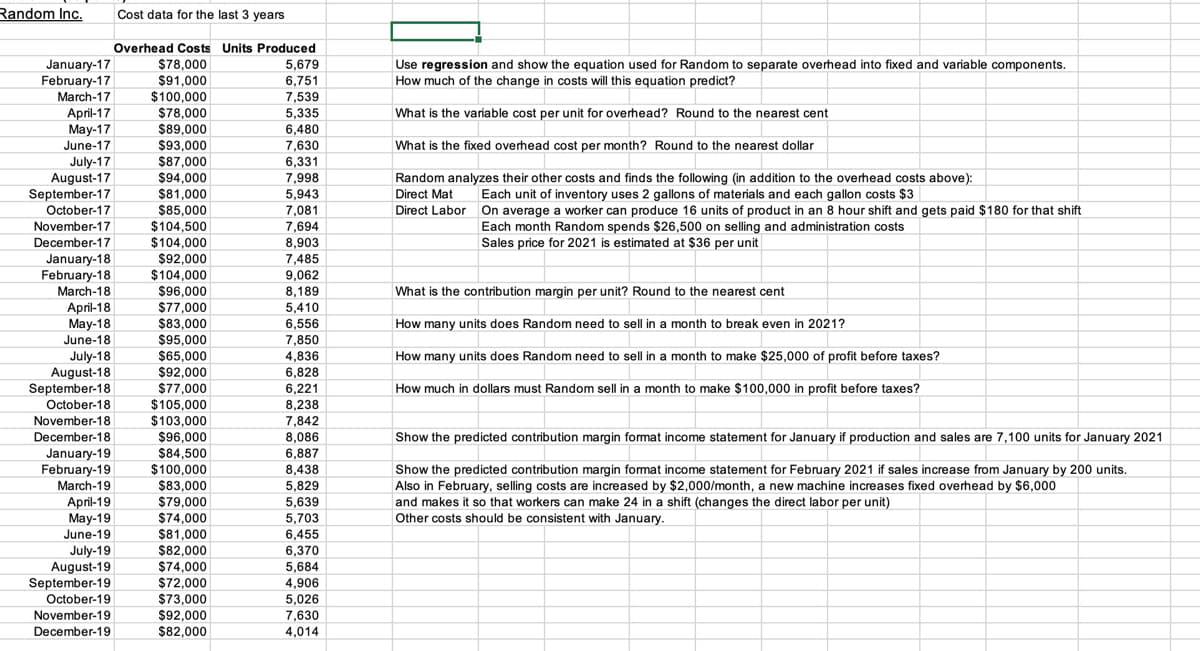
Transcribed Image Text:Random Inc.
Cost data for the last 3 years
Overhead Costs Units Produced
January-17
February-17
$78,000
Use regression and show the equation used for Random to separate overhead into fixed and variable components.
How much of the change in costs will this equation predict?
5,679
$91,000
$100,000
6,751
7,539
March-17
April-17
Мay-17
June-17
$78,000
$89,000
5,335
What is the variable cost per unit for overhead? Round to the nearest cent
6,480
$93,000
$87,000
$94,000
June-17
7,630
What is the fixed overhead cost per month? Round to the nearest dollar
July-17
August-17
September-17
October-17
6,331
7 998
7,998
5 043
5,943
Random analyzes their other costs and finds the following (in addition to the overhead costs above):
Direct Mat
$81,000
$85,000
$104,500
$104,000
Each unit of inventory uses 2 gallons of materials and each gallon costs $3
On average a worker can produce 16 units of product in an 8 hour shift and gets paid $180 for that shift
Each month Random spends $26,500 on selling and administration costs
Sales price for 2021 is estimated at $36 per unit
7 081
7,081
Direct Labor
November-17
7,694
December-17
8,903
7,485
9,062
8,189
5,410
January-18
February-18
March-18
$92,000
$104,000
$96,000
$77,000
$83,000
$95,000
What is the contribution margin per unit? Round to the nearest cent
April-18
May-18
6,556
7,850
4,836
6,828
How many units does Random need to sell in a month to break even in 2021?
June-18
How many units does Random need to sell in a month to make $25,000 of profit before taxes?
July-18
August-18
September-18
$65,000
$92,000
$77,000
6,221
8,238
7,842
8,086
6,887
How much in dollars must Random sell in a month to make $100,000 in profit before taxes?
$105,000
$103,000
$96,000
October-18
November-18
December-18
Show the predicted contribution margin format income statement for January if production and sales are 7,100 units for January 2021
January-19
February-19
March-19
April-19
May-19
June-19
$84,500
$100,000
$83,000
$79,000
$74,000
$81,000
8,438
Show the predicted contribution margin format income statement for February 2021 if sales increase from January by 200 units.
5,829
5,639
5,703
6,455
6,370
Also in February, selling costs are increased by $2,000/month, a new machine increases fixed overhead by $6,000
and makes it so that workers can make 24 in a shift (changes the direct labor per unit)
Other costs should be consistent with January.
$82,000
$74,000
$72,000
July-19
August-19
September-19
October-19
November-19
December-19
5,684
4,906
5,026
7,630
$73,000
$92,000
$82,000
4,014
Expert Solution
This question has been solved!
Explore an expertly crafted, step-by-step solution for a thorough understanding of key concepts.

This is a popular solution!

Trending now
This is a popular solution!

Step by step
Solved in 6 steps with 2 images

Knowledge Booster


Learn more about
Need a deep-dive on the concept behind this application? Look no further. Learn more about this topic, accounting and related others by exploring similar questions and additional content below.Recommended textbooks for you
Cornerstones of Cost Management (Cornerstones Ser…
Accounting
ISBN:
9781305970663
Author:
Don R. Hansen, Maryanne M. Mowen
Publisher:
Cengage Learning

Principles of Accounting Volume 2
Accounting
ISBN:
9781947172609
Author:
OpenStax
Publisher:
OpenStax College

Managerial Accounting: The Cornerstone of Busines…
Accounting
ISBN:
9781337115773
Author:
Maryanne M. Mowen, Don R. Hansen, Dan L. Heitger
Publisher:
Cengage Learning
Cornerstones of Cost Management (Cornerstones Ser…
Accounting
ISBN:
9781305970663
Author:
Don R. Hansen, Maryanne M. Mowen
Publisher:
Cengage Learning
Principles of Accounting Volume 2
Accounting
ISBN:
9781947172609
Author:
OpenStax
Publisher:
OpenStax College
Managerial Accounting: The Cornerstone of Busines…
Accounting
ISBN:
9781337115773
Author:
Maryanne M. Mowen, Don R. Hansen, Dan L. Heitger
Publisher:
Cengage Learning

Managerial Accounting
Accounting
ISBN:
9781337912020
Author:
Carl Warren, Ph.d. Cma William B. Tayler
Publisher:
South-Western College Pub

Principles of Cost Accounting
Accounting
ISBN:
9781305087408
Author:
Edward J. Vanderbeck, Maria R. Mitchell
Publisher:
Cengage Learning

Financial And Managerial Accounting
Accounting
ISBN:
9781337902663
Author:
WARREN, Carl S.
Publisher:
Cengage Learning,