Capacitance values between Class Frequency (µF) 94-95.9 7 96-97.9 19 98-99.9 35 100-101.9 31 102-103.9 23 104-105.9
Capacitance values between Class Frequency (µF) 94-95.9 7 96-97.9 19 98-99.9 35 100-101.9 31 102-103.9 23 104-105.9

Glencoe Algebra 1, Student Edition, 9780079039897, 0079039898, 2018
18th Edition
ISBN:9780079039897
Author:Carter
Publisher:Carter
Chapter10: Statistics
Section10.5: Comparing Sets Of Data
Problem 13PPS

Related questions
Question
Answer this question.
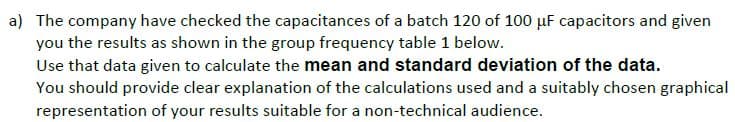
Transcribed Image Text:a) The company have checked the capacitances of a batch 120 of 100 µF capacitors and given
you the results as shown in the group frequency table 1 below.
Use that data given to calculate the mean and standard deviation of the data.
You should provide clear explanation of the calculations used and a suitably chosen graphical
representation of your results suitable for a non-technical audience.
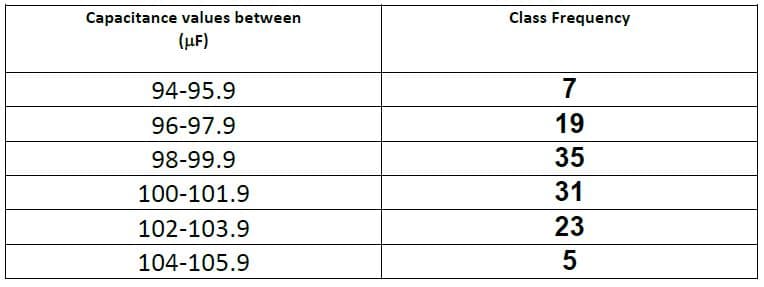
Transcribed Image Text:Capacitance values between
Class Frequency
(µF)
94-95.9
7
96-97.9
19
98-99.9
35
100-101.9
31
102-103.9
23
104-105.9
5
Expert Solution
This question has been solved!
Explore an expertly crafted, step-by-step solution for a thorough understanding of key concepts.

Step by step
Solved in 3 steps with 3 images

Knowledge Booster


Learn more about
Need a deep-dive on the concept behind this application? Look no further. Learn more about this topic, advanced-math and related others by exploring similar questions and additional content below.Recommended textbooks for you
Glencoe Algebra 1, Student Edition, 9780079039897…
Algebra
ISBN:
9780079039897
Author:
Carter
Publisher:
McGraw Hill
Glencoe Algebra 1, Student Edition, 9780079039897…
Algebra
ISBN:
9780079039897
Author:
Carter
Publisher:
McGraw Hill