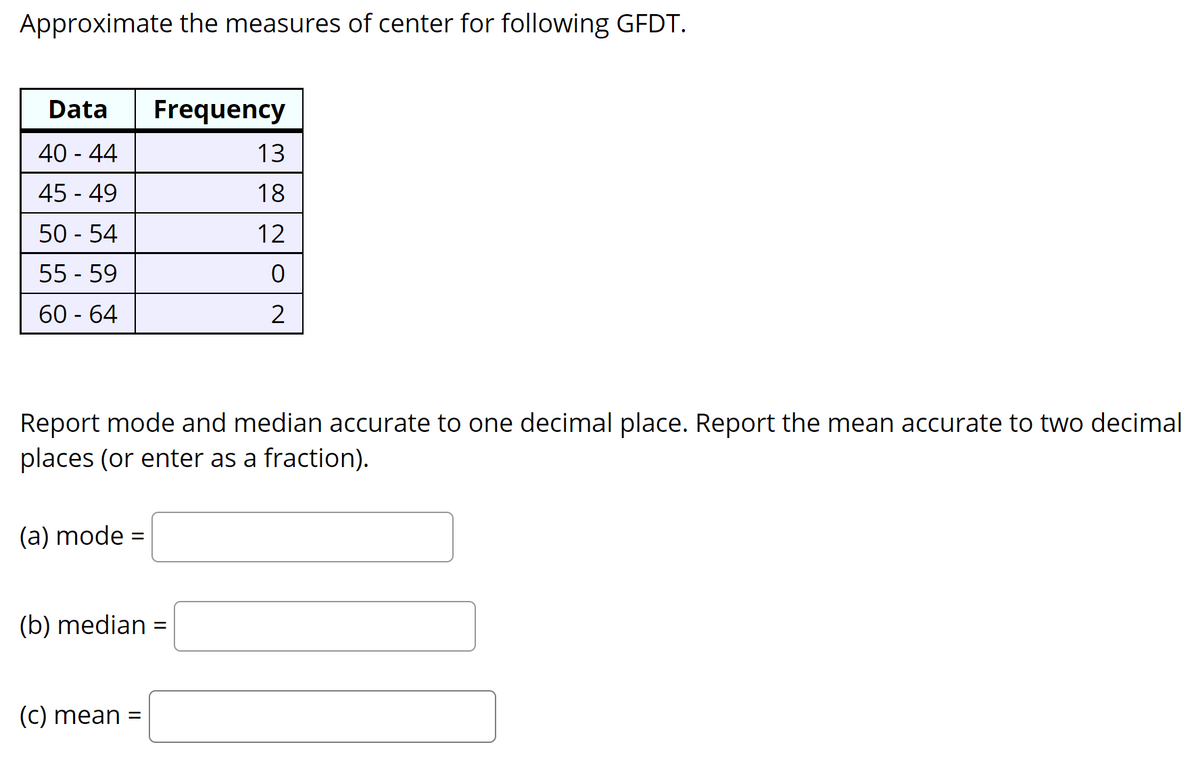
Data Frequency 40 - 44 13 45 - 49 18 50 - 54 12 55 - 59 60 - 64 2 Report mode and median accurate to one decimal place. Report the mean accurate to two decimal places (or enter as a fraction). (a) mode = (b) median = (C) mean =


Q: uestion 9 Given the histogram of percentage of cotton in material used to manufacture men's shirt.…
A:
Q: Number of minutes Frequency Use the frequency distibution to approximate the mean number of minutes…
A: Note: Hey there! Thank you for the question. Although you have asked to help you with Parts d, e,…
Q: 5.43 Chicken diet and weight, Part III: In Exercises 5.31 and 5.33 we compared the effects of two…
A: Consider that μc, μh, μl, μm, μsoy and μsun are the average weights of chicks of feed types of…
Q: 2. The level of dissolved oxygen in the surface water of a lake is vital to maintaining the lake's…
A: Given: Sr. No. Data (x) 1 9.6 2 4.5 3 13.2 4 4.1 5 22.6 6 14.7 7 3.5 8 13.6…
Q: Measure of Dispersion: a) Calculate the Range b) Calculate the Variance Calculate the Standard…
A: a) Range: The range is the difference between the largest and smallest observations in a set of…
Q: 17. An experiment is carried out on the rearing of cows. The mass gain (in kilogram) for 100 cows…
A: The mean is the average you're used to, where you add up all the numbers and then divide by the…
Q: Calculating Sample Statistics 2. Listed are head injury measurements from small cars that were…
A: Hey, since there are multiple questions posted, we will answer first question. If you want any…
Q: median and mode, Q1, Q3, De and Ps of the fo grouped data. 1. Weight of 50 women in a fitness club…
A: Mean is the average value around which the whole data set is concentrated. For the grouped frequency…
Q: Time series analysis is LEAST helpful in forecasting and predictive applications when the a. data…
A: Answer : Option (a) ✔️ Time series analysis is LEAST helpful in forecasting and predictive…
Q: Value Frequency 3 Find the mean of the estimated miles per gallon of the automobiles in the table to…
A: Solution
Q: Analysis of Variance Source DF MS Regression 1 Residual Error 13 0.2364 Total 14 11.3240 What is the…
A: Solution
Q: Temperature (°F) Frequency 45-49 3 50-54 Does the frequency distribution appear to have a normal…
A: The data shows the temperature with their frequencies.
Q: Section 3-1 Measures of Central Tendency 125 27. Final Grade An instructor grades exams, 20%; term…
A: Given that the instructor grades, 20% from exams, 30% from term paper and 50% from final exam.The…
Q: The time series pattern that exists when the data fluctuate around a constant mean is the…
A: Correct option is A. A. horizontal pattern.
Q: Descriptive Statistics Range Minimum Maximum Statistic Statistic Statistic Statistic Secondary…
A: The statistic N represents the size of the sample. The range is defined as the difference between…
Q: Number of Average Employees Xm FXm Xm-X f(Xm-X)2 <cf Production A 61-65 2 66-70 8 71-75 11 76-80 17…
A:
Q: η Σ χ-Σx ν η Σ 2-(Σ x • m = O b = Ey-m x n η Σ w-ΣxΣy Οr x)- Regression Line : y = mx + b
A:
Q: Arsenic in Rice Listed below are measured amounts ( μ g per serving) of arsenic in a sample of…
A: The data is based on the amount of arsenic in the sample of brown rice. The class width is 2µg and…
Q: Model N MEAN MEDIAN TRI.MEAN STD DEV S.E. MEAN Hyundai 23 109 135 107.64 * 1.34 Toyota 27 165 124…
A: Solution: Given information: n= 23 Sample size of Hyundai x= 109 Sample mean of Hyundai μ= 110…
Q: Quantitative value that characterizes a sample * a) Parameter b) Statistic c) Sample d) Data
A:
Q: Credit Score 0-15 15-30 30-45 45-60 60-75 75-90 90+ Number of Applicants 70 45 25 30 23 10 0 Compute…
A: Given that Frequency distribution table Class Frequency 0 - 15 70 15 - 30 45 30 - 45 25…
Q: II. Frequency Distribution Table. Solve the mean and complete the table below. Class Frequency…
A: The distribution table is given with frequencies.
Q: Characteristics Treatment Control P-value Mean SBP 115.3889± 113.0588±6.805 Mean…
A: The p-value is nothing but the how likely it is that your data could have occurred under the null…
Q: Climate change 2013 Data collected from around the globe show that the earth is getting warmer. The…
A: The equation of the regression line is stated in the form of y =…
Q: Comparing Heights of Men and Women in this experiment we use two small data sets as a quick…
A:
Q: Earthquake Depths Data Set 21 "Earthquakes" O in Appendix BO lists earthquake depths, and the…
A:
Q: In point estimation a. data from the sample is used to estimate the population parameter O b. the…
A: This is used to estimate a parameter (say mean) of a population by taking data from samples.
Q: Temperature ("F) 35-39 40-44 45-49 50-54 55-59 Frequency 3 Does the frequency distribution appear to…
A: Solution: The frequency distribution table is Temperature (F) Frequency 35-39 1 40 -44 3…
Q: 10-19 20-29 30-39 8 40-49 50-59 10 60-69 12 70-79 13 80-89 18 90-99 14 100-109 11 110-119 8. 4…
A: Given data is appropriate for measures of central tendency any measures of dispersion. And given…
Q: Number of minutes Frequency Use the frequency distibution to approximate the mean number of minutes…
A: Frequency for any observation is equal to the number of times the observation repeated in the…
Q: percentile of a distribution is that value that exceeds 60 percent of the measure d by 40 percent of…
A: NOTE: As stated by the student, I am solving d), e) and f) part. ( also according to the guidelines,…
Q: Data/565-Hypothesis testing for comparing population means uses the difference (x1 - x2) where the…
A: For testing the hypothesis that, H0: u1-u2= 0 H1: u1-u2=!0 (Comparison of 2 means) We use z test…
Q: MEASURES OF CENTRAL TENDENDCY (GROUPED DATA OUTPUT) Complete the frequency distribution table below.…
A:
Q: Height distributions generally have a predictable pattern. In a large introductory statistics class,…
A: Histogram is quantitative graphical measure that represents the frequencies of different outcomes.…
Q: Returns Year Y 1 14 % 20 % 17 29 3. 8. 15 - 10 10 4. - 11 19 Using the returns shown above,…
A: For X: The returns are 14, 17, 8, –10, and 10.
Q: Stemplots. In Exercises 7 and 8, construct the stemplot. 8. Diastolic Blood Pressure Refer to the…
A: The data set deals with the diastolic blood pressure measurements of females and all the values for…
Q: Age Groups Frequency Q-8: For the fallowing frequency distribution, calculate arithmetic, geometric,…
A: “Since you have asked multiple questions, we will solve the first question for you. If you want any…
Q: The body mass index (BMI) of a person is the person’s weight divided by the square of his or her…
A: We have to find pair of hypothesis.
Q: Warming and Ice Melt The average depth of the Hudson Bay is 305 feet. Climatologists were…
A: a) Consider that μ is the true average depth. It is needed to check, whether the average depth has…
Q: Cumulative Relative Frequency 50 Relative Frequency 16. Complete the tables using the data provided:…
A: As per guidelines we will solve first question only, please repost other questions for more answers.…
Q: Correlation Eunice Consultancy took a random sample of the monthly office rents per square meter…
A:
Q: Number of Average Employees Xm-X f(Xm-X)2 Xm FXm <cf Production A 61-65 66-70 8. 71-75 11 76-80 17…
A:
Q: Flight Arrivals Listed below are the arrival delay times (min) of randomly selected American…
A: Levels of measurement:Nominal: It consists of only categories in which the data cannot be arranged…
Q: Temperature (°F) Frequency 45-49 50-54 6 Does the frequency distribution appear to have a normal…
A: According to the given information, we have The frequency distribution is given.
Q: Level of Measurement What is the level of measurement of these data (nominal, ordinal, interval,…
A: Given info: The data shows that, the arrival delay times of randomly selected American Airlines…
Q: Cotinine (Nonsmokers Exposed to Smoke in ng/mL) 0-99 100 - 199 200 - 299 300 - 399 400 - 499 500 -…
A: Since you have asked multiple question, we will solve the first question for you. If youwant any…
Q: Strength of concrete: The compressive strength, in kilopascals, was measured for concrete blocks…
A: Given that Sample size n =5 Level of significance =0.05
Q: 11. A consumers group recently tested 100 compact fluorescent light bulbs and recorded their…
A:
Q: llustration 11.12. You are given the position in a factory before and after the settlement of an…
A:

Step by step
Solved in 2 steps with 3 images


- Approximate the measures of center for following GFDT. Data Frequency 50 - 54 2 55 - 59 4 60 - 64 7 65 - 69 15 70 - 74 21 75 - 79 10 80 - 84 7 85 - 89 0 90 - 94 7 mode = median = mean = Report mode and median accurate to one decimal place. Report the mean accurate to two decimal places (or enter as a fraction).Approximate the measures of center for following GFDT. Data Frequency 30 - 34 2 35 - 39 0 40 - 44 14 45 - 49 20 50 - 54 13 Report mode and median accurate to one decimal place. Report the mean accurate to two decimal places (or enter as a fraction). (a) mode = (b) median = (c) mean =Radon is a colorless, odorless, invisible gas that seeps into residential homes and has been linked to lung cancer. A generally acceptable safe level of radon is 4 pCi/L. A radon detection device measures the radon level once per hour at a randomly selected time throughout a one-week period. Then it calculates the mean radon level for the sample of measurements. Based on the sample results, the device performs a test of H0 : µ = 4 versus Ha : µ > 4, where µ is the true mean radon level. (a) Describe a Type I error.(b) Give a consequence of making a Type I error. (c) Describe a Type II error.(d) Give a consequence of making a Type II error. (e) Which error is more serious? Why?
- Radon is a colorless, odorless, invisible gas that seeps into residential homes and has been linked to lung cancer. A generally acceptable safe level of radon is 4 pCi/L. A radon detection device measures the radon level once per hour at a randomly selected time throughout a one-week period. Then it calculates the mean radon level for the sample of measurements. Based on the sample results, the device performs a test of H0: µ = 4 versus Ha : µ > 4, where µ is the true mean radon level. (c) Describe a Type II error.(d) Give a consequence of making a Type II error. (e) Which error is more serious? Why?The specifications for a plastic liner for concrete high-way projects calls for a thickness of 3.0 mm {.1 mm. The stand-ard deviation of the process is estimated to be .02 mm. What are the upper and lower specification limits for this product? The pro-cess is known to operate at a mean thickness of 3.0 mm. What is the Cpk for this process? About what percentage of all units of thisliner will meet specifications?A method of applying zinc plating to steel is supposed to produce a coating whose mean thickness is no greater than 7 microns. A quality inspector measures the thickness of 36 coated specimens and tests H0: μ ≤ 7 versus H1: μ > 7. She obtains a P-value of 0.40. Since P > 0.05, she concludes that the mean thickness is within the specification. Is this conclusion correct? Explain.
- In a manufacturing process, the impurity level of the product is measured on a daily basis. When the pro-cess is operating normally, the impurity level is approx-imately normally distributed with a mean value of 0.800% and a standard deviation of 0.021%. The laboratory measurements for a period of eight consecutive days are shown below. From an SPC perspective, is there strong evidence to believe that the mean value of the impurity has shifted? Justify your answer.develop CUSUM and EWMA charts. Do these charts indicate an “abnor-mal situation”? Justify your answer. For the CUSUM chart, use K=0.5s and H=5s where s is the sample standard deviation. For the EWMA chart, use λ=0.25.2.A politician is interested in the proportion of voters in his district that think he is doing a good job.Define the following in terms of the study. Give examples where appropriate.PopulationSampleParameterStatisticVariableData1: Parameters for a study measuring the level of depression among software engineers, σ = 9; X=63; z = 3.00. Calculate the mean of the population.
- The strength of concrete depends, to some extent, on the method used for drying. Two different drying methods showed the following results for independently tested specimens (measurements in psi): Do the methods appear to produce concrete with different mean strengths? Use α = 0.05 .Product specifications at a local Metalwork company are 1000 ± .040. currently, the process is performing at a grand average of 1000 with a standard deviation of 0.010. a). Calculate the process capability ratio and index. b). Is the process capable? Justify your answer.Dr. Johnson is interested in the difference in mean systolic blood pressure between groups. He performs analysis and finds a mean difference of 0.0005 mmHg in systolic blood pressure with a p value of 0.001. Dr. Johnson's findings are: a) statistically insignificant and practically significant b) statistically significant and practically significant c) statistically insignificant and practically insignificant d) statistically significant but practically ins