Reliability data on an automated production machine are mean time between failures = 37.4 hr and mean time to repair = 34 min. The utilization of the machine is 89%. The fraction defect rate of the parts made on the machine is 1.1%. Its rated operating speed is 75 parts/hr, but it only operates at 62 parts/hr. (a) What is the overall equipment effectiveness of this machine? (b) The reliability and fraction defect rate would be difficult to improve upon, but utilization and rated speed could be increased. What values of utilization and operating speed would allow the overall equipment effectiveness to be increased to 85%.
Reliability data on an automated production machine are mean time between failures = 37.4 hr and mean time to repair = 34 min. The utilization of the machine is 89%. The fraction defect rate of the parts made on the machine is 1.1%. Its rated operating speed is 75 parts/hr, but it only operates at 62 parts/hr. (a) What is the overall equipment effectiveness of this machine? (b) The reliability and fraction defect rate would be difficult to improve upon, but utilization and rated speed could be increased. What values of utilization and operating speed would allow the overall equipment effectiveness to be increased to 85%.

College Algebra
7th Edition
ISBN:9781305115545
Author:James Stewart, Lothar Redlin, Saleem Watson
Publisher:James Stewart, Lothar Redlin, Saleem Watson
Chapter1: Equations And Graphs
Section: Chapter Questions
Problem 10T: Olympic Pole Vault The graph in Figure 7 indicates that in recent years the winning Olympic men’s...

Related questions
Question
1.
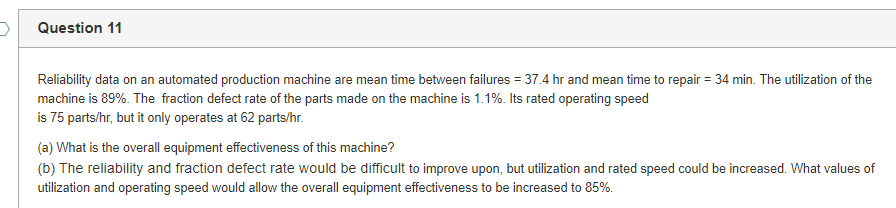
Transcribed Image Text:Question 11
Reliability data on an automated production machine are mean time between failures = 37.4 hr and mean time to repair = 34 min. The utilization of the
machine is 89%. The fraction defect rate of the parts made on the machine is 1.1%. Its rated operating speed
is 75 parts/hr, but it only operates at 62 parts/hr.
(a) What is the overall equipment effectiveness of this machine?
(b) The reliability and fraction defect rate would be difficult to improve upon, but utilization and rated speed could be increased. What values of
utilization and operating speed would allow the overall equipment effectiveness to be increased to 85%.
Expert Solution
This question has been solved!
Explore an expertly crafted, step-by-step solution for a thorough understanding of key concepts.

This is a popular solution!

Trending now
This is a popular solution!

Step by step
Solved in 3 steps

Recommended textbooks for you
College Algebra
Algebra
ISBN:
9781305115545
Author:
James Stewart, Lothar Redlin, Saleem Watson
Publisher:
Cengage Learning

Linear Algebra: A Modern Introduction
Algebra
ISBN:
9781285463247
Author:
David Poole
Publisher:
Cengage Learning

College Algebra
Algebra
ISBN:
9781305115545
Author:
James Stewart, Lothar Redlin, Saleem Watson
Publisher:
Cengage Learning
Linear Algebra: A Modern Introduction
Algebra
ISBN:
9781285463247
Author:
David Poole
Publisher:
Cengage Learning