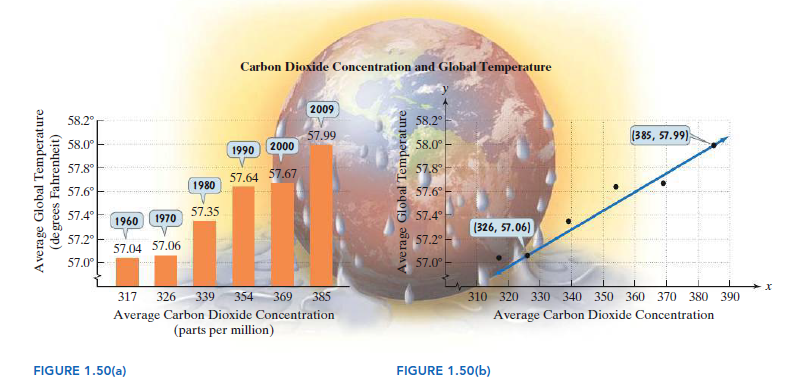
Carbon Dioxide Concentration and Global Temperature 2009 58.2 58.2° 57.99 (385, 57.99) 58.0° 2000 58.0° 1990 57.8 57.8° 57.64 57.67 1980 57.6° 57.6° 57.4° 57.35 57.4 1960 1970 (326, 57.06) 57.2 57.2°- 57.04 57.06 57.0° 57.0° 317 326 339 354 369 385 310 320 330 340 350 360 370 380 390 Average Carbon Dioxide Concentration (parts per million) Average Carbon Dioxide Concentration FIGURE 1.50(a) FIGURE 1.50(b) Average Global Temperature (de grees Fahrenheit) Average Global Temperature


The amount of carbon dioxide in the atmosphere, measured in parts per million, has been increasing as a result of the burning of oil and coal. The buildup of gases and particles traps heat and raises the planet’s temperature. The bar graph in Figure (a) gives the average atmospheric concentration of carbon dioxide and the average global temperature for six selected years. The data are displayed as a set of six points in a rectangular
Solve, Use the data points (317, 57.04) and (354, 57.64), shown, but not labeled, in Figure (b) [see attached herewith] to obtain a linear function that models average global temperature, f(x), for an atmospheric carbon dioxide concentration of x parts per million. Round m to three decimal places and b to one decimal place. Then use the function to project average global temperature at a concentration of 600 parts per million.


Trending now
This is a popular solution!

Step by step
Solved in 4 steps with 4 images


