Cardiovascular Disease The data in Table 1 are a sample of cholesterol levels taken from 24 hospital employees who were on a stan- dard American diet and who agreed to adopt a vegetarian diet for 1 month. Serum-cholesterol measure- ments were made before adopting the diet and 1 month after. Subject Before After Difference* 1 195 146 49 2 145 155 -10 3 205 178 27 4 159 146 13 5 244 208 36 6 166 147 19 7 250 202 48 8 236 215 21 9 192 184 8 10 224 208 11 238 206 12 197 169 13 169 182 14 158 127 15 151 149 16 197 178 17 180 161 18 222 187 19 168 176 20 168 145 21 167 154 22 161 153 23 178 137 41 24 137 125 12 *Before after. 1. Compute the mean change in cholesterol. 2. Compute the standard deviation of the change in cholesterol levels. 3. Compute the median change in cholesterol. 4. Construct a box plot of the cholesterol changes. 5. Comment on the symmetry of the distribution of change scores based on your answers to Problems 1 and 4. 6. Is the change in cholesterol levels leptokurtic? Support your answer. 7. Construct a frequency distribution table for the change in cholesterol levels. DO ONLY no. 5 16 32 28 -13 31 2 19 19 35 -8 23 13 8
Cardiovascular Disease The data in Table 1 are a sample of cholesterol levels taken from 24 hospital employees who were on a stan- dard American diet and who agreed to adopt a vegetarian diet for 1 month. Serum-cholesterol measure- ments were made before adopting the diet and 1 month after. Subject Before After Difference* 1 195 146 49 2 145 155 -10 3 205 178 27 4 159 146 13 5 244 208 36 6 166 147 19 7 250 202 48 8 236 215 21 9 192 184 8 10 224 208 11 238 206 12 197 169 13 169 182 14 158 127 15 151 149 16 197 178 17 180 161 18 222 187 19 168 176 20 168 145 21 167 154 22 161 153 23 178 137 41 24 137 125 12 *Before after. 1. Compute the mean change in cholesterol. 2. Compute the standard deviation of the change in cholesterol levels. 3. Compute the median change in cholesterol. 4. Construct a box plot of the cholesterol changes. 5. Comment on the symmetry of the distribution of change scores based on your answers to Problems 1 and 4. 6. Is the change in cholesterol levels leptokurtic? Support your answer. 7. Construct a frequency distribution table for the change in cholesterol levels. DO ONLY no. 5 16 32 28 -13 31 2 19 19 35 -8 23 13 8

Big Ideas Math A Bridge To Success Algebra 1: Student Edition 2015
1st Edition
ISBN:9781680331141
Author:HOUGHTON MIFFLIN HARCOURT
Publisher:HOUGHTON MIFFLIN HARCOURT
Chapter11: Data Analysis And Displays
Section: Chapter Questions
Problem 10CT

Related questions
Question
SKIP THIS IF YOU ALREADY ANSWERED THIS. I WILL ONLY UPVOTE IF IT IS TYPEWRITTEN. FOLLOW THE INSTRUCTIONS AND DO IT COMPLETELY. DOWNVOTE IF YOU ANSWERED THIS AGAIN. THANK YOU
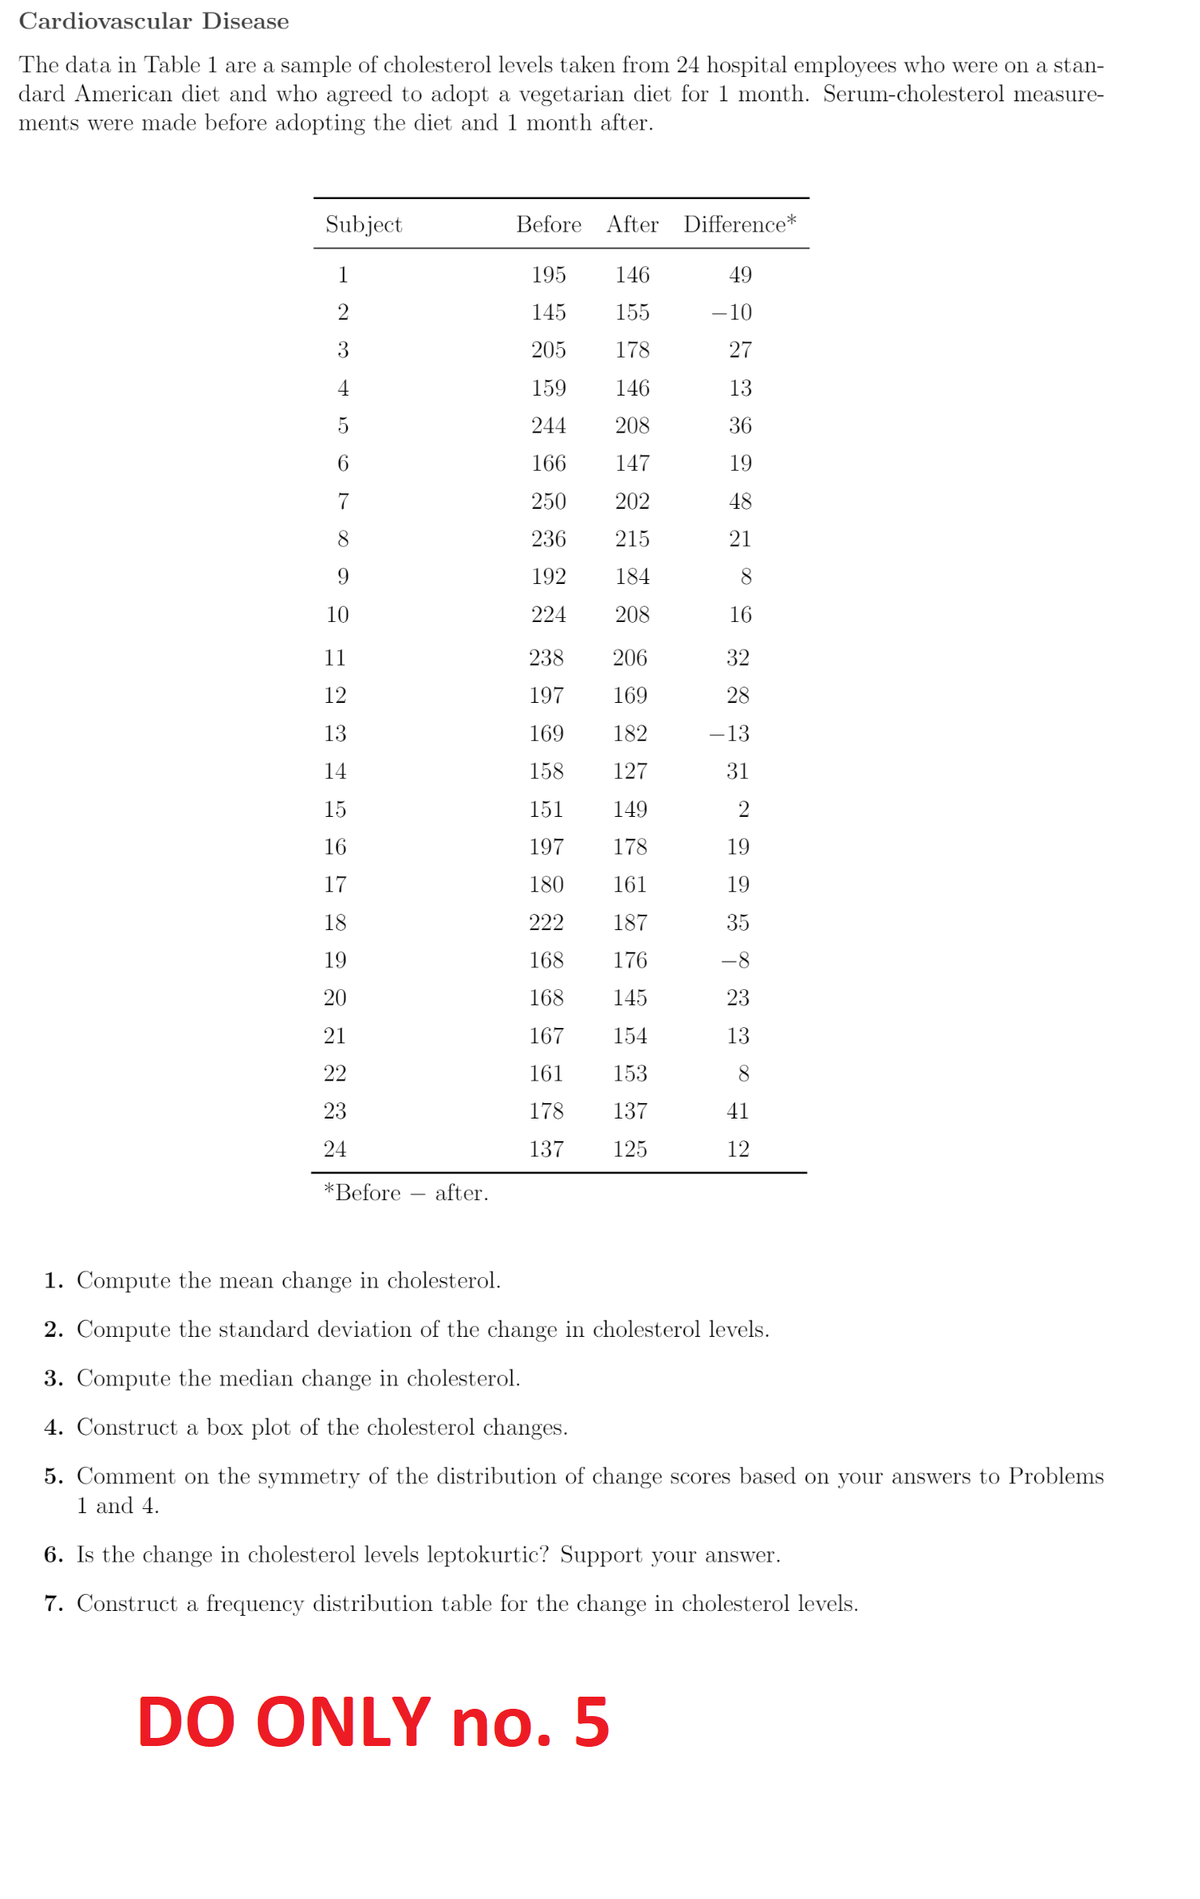
Transcribed Image Text:Cardiovascular Disease
The data in Table 1 are a sample of cholesterol levels taken from 24 hospital employees who were on a stan-
dard American diet and who agreed to adopt a vegetarian diet for 1 month. Serum-cholesterol measure-
ments were made before adopting the diet and 1 month after.
Subject
Before After Difference*
1
195
146
49
2
145
155
-10
3
205
178
27
4
159
146
13
5
244
208
36
6
166
147
19
7
250
202
48
8
236
215
21
9
192
184
8
10
224
208
11
238 206
12
197
169
13
169
182
14
158
127
15
151
149
16
197 178
17
180
161
18
222 187
19
168
176
20
168 145
21
167
154
22
161 153
23
178
137
41
24
137
125
12
*Before after.
1. Compute the mean change in cholesterol.
2. Compute the standard deviation of the change in cholesterol levels.
3. Compute the median change in cholesterol.
4. Construct a box plot of the cholesterol changes.
5. Comment on the symmetry of the distribution of change scores based on your answers to Problems
1 and 4.
6. Is the change in cholesterol levels leptokurtic? Support your answer.
7. Construct a frequency distribution table for the change in cholesterol levels.
DO ONLY no. 5
16
32
28
-13
31
2
19
19
35
-8
23
13
8
Expert Solution
This question has been solved!
Explore an expertly crafted, step-by-step solution for a thorough understanding of key concepts.

This is a popular solution!

Trending now
This is a popular solution!

Step by step
Solved in 3 steps with 2 images

Recommended textbooks for you
Big Ideas Math A Bridge To Success Algebra 1: Stu…
Algebra
ISBN:
9781680331141
Author:
HOUGHTON MIFFLIN HARCOURT
Publisher:
Houghton Mifflin Harcourt

Glencoe Algebra 1, Student Edition, 9780079039897…
Algebra
ISBN:
9780079039897
Author:
Carter
Publisher:
McGraw Hill
Big Ideas Math A Bridge To Success Algebra 1: Stu…
Algebra
ISBN:
9781680331141
Author:
HOUGHTON MIFFLIN HARCOURT
Publisher:
Houghton Mifflin Harcourt
Glencoe Algebra 1, Student Edition, 9780079039897…
Algebra
ISBN:
9780079039897
Author:
Carter
Publisher:
McGraw Hill