Carlson Automotive Company manufactures fuel-injection systems. It manufactured and sold 60,000 units in 2018 and 64,000 units in 2019 at $25 per unit. In 2018, the firm used 75,000 pounds of alloy TPX–45 at $7.20 per pound and used 10,000 direct labor hours at an hourly wage rate of $30. In 2019, the firm used 89,600 pounds of alloy TPX-45 at $6.80 per pound and used 10,847 direct labor hours at an hourly wage rate of $32. The total amount of all other expenses remains the same at $450,000 each year. Jerry Olson, CEO, was disappointed that although the total sales increased in 2019, operating income declined from $210,000 in 2018 to $193,616 in 2019. Required Analyze the following: 1. Partial operational productivity of direct material and direct labor for both 2018 and 2019. 2. Partial financial productivity of direct material and direct labor for both 2018 and 2019. 3. Detailed partition of partial financial productivity. 4. Total productivity for 2018 and 2019 as measured in both units and sales dollars.
Carlson Automotive Company manufactures fuel-injection systems. It manufactured and sold 60,000 units in 2018 and 64,000 units in 2019 at $25 per unit. In 2018, the firm used 75,000 pounds of alloy TPX–45 at $7.20 per pound and used 10,000 direct labor hours at an hourly wage rate of $30. In 2019, the firm used 89,600 pounds of alloy TPX-45 at $6.80 per pound and used 10,847 direct labor hours at an hourly wage rate of $32. The total amount of all other expenses remains the same at $450,000 each year. Jerry Olson, CEO, was disappointed that although the total sales increased in 2019, operating income declined from $210,000 in 2018 to $193,616 in 2019. Required Analyze the following: 1. Partial operational productivity of direct material and direct labor for both 2018 and 2019. 2. Partial financial productivity of direct material and direct labor for both 2018 and 2019. 3. Detailed partition of partial financial productivity. 4. Total productivity for 2018 and 2019 as measured in both units and sales dollars.

Cornerstones of Cost Management (Cornerstones Series)
4th Edition
ISBN:9781305970663
Author:Don R. Hansen, Maryanne M. Mowen
Publisher:Don R. Hansen, Maryanne M. Mowen
Chapter8: Budgeting For Planning And Control
Section: Chapter Questions
Problem 33E: A companys controller is adjusting next years budget to reflect the impact of an expected 3 percent...

Related questions

Concept explainers
Variance Analysis
In layman's terms, variance analysis is an analysis of a difference between planned and actual behavior. Variance analysis is mainly used by the companies to maintain a control over a business. After analyzing differences, companies find the reasons for the variance so that the necessary steps should be taken to correct that variance.
Standard Costing
The standard cost system is the expected cost per unit product manufactured and it helps in estimating the deviations and controlling them as well as fixing the selling price of the product. For example, it helps to plan the cost for the coming year on the various expenses.
Topic Video
Question
100%
Transcribed Image Text:udy 1. Productivity Variances
ems
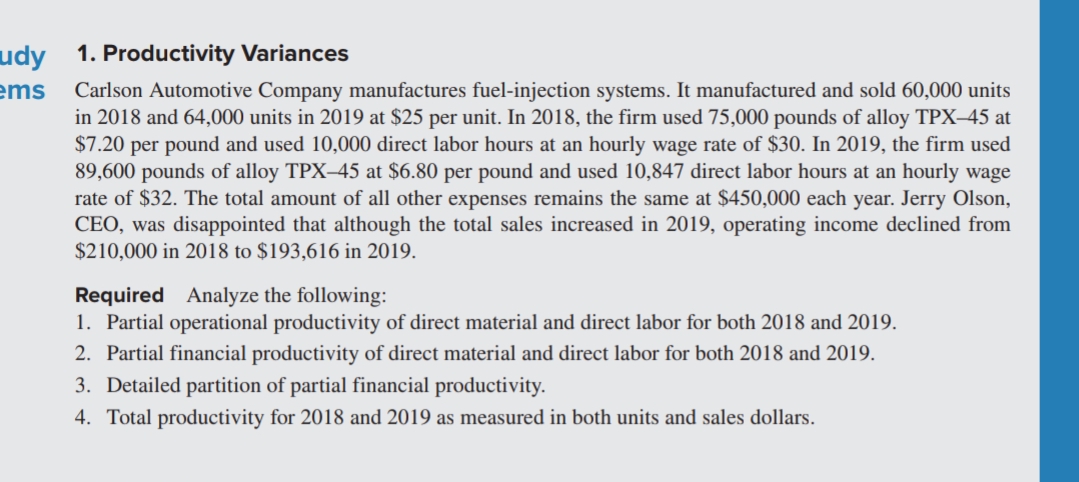
Carlson Automotive Company manufactures fuel-injection systems. It manufactured and sold 60,000 units
in 2018 and 64,000 units in 2019 at $25 per unit. In 2018, the firm used 75,000 pounds of alloy TPX–45 at
$7.20 per pound and used 10,000 direct labor hours at an hourly wage rate of $30. In 2019, the firm used
89,600 pounds of alloy TPX–45 at $6.80 per pound and used 10,847 direct labor hours at an hourly wage
rate of $32. The total amount of all other expenses remains the same at $450,000 each year. Jerry Olson,
CEO, was disappointed that although the total sales increased in 2019, operating income declined from
$210,000 in 2018 to $193,616 in 2019.
Required Analyze the following:
1. Partial operational productivity of direct material and direct labor for both 2018 and 2019.
2. Partial financial productivity of direct material and direct labor for both 2018 and 2019.
3. Detailed partition of partial financial productivity.
4. Total productivity for 2018 and 2019 as measured in both units and sales dollars.
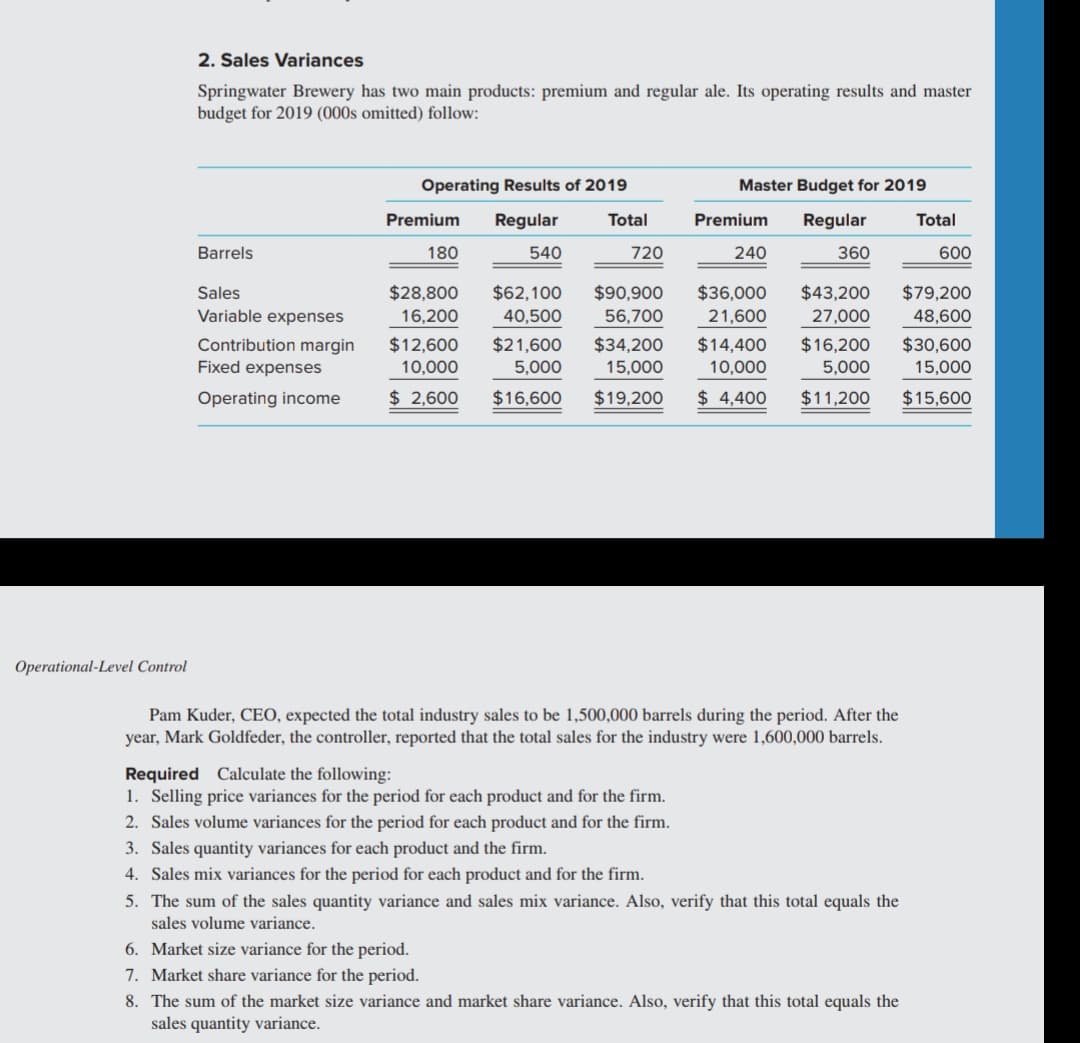
Transcribed Image Text:2. Sales Variances
Springwater Brewery has two main products: premium and regular ale. Its operating results and master
budget for 2019 (000s omitted) follow:
Operating Results of 2019
Master Budget for 2019
Premium
Regular
Total
Premium
Regular
Total
Barrels
180
540
720
240
360
600
$28,800
$62,100
40,500
$90,900
56,700
Sales
$36,000
$43,200
$79,200
Variable expenses
16,200
21,600
27,000
48,600
Contribution margin
Fixed expenses
$12,600
10,000
$21,600
5,000
$34,200
15,000
$14,400
10,000
$16,200
5,000
$30,600
15,000
Operating income
$ 2,600
$16,600
$19,200
$ 4,400
$11,200
$15,600
Operational-Level Control
Pam Kuder, CEO, expected the total industry sales to be 1,500,000 barrels during the period. After the
year, Mark Goldfeder, the controller, reported that the total sales for the industry were 1,600,000 barrels.
Required Calculate the following:
1. Selling price variances for the period for each product and for the firm.
2. Sales volume variances for the period for each product and for the firm.
3. Sales quantity variances for each product and the firm.
4. Sales mix variances for the period for each product and for the firm.
5. The sum of the sales quantity variance and sales mix variance. Also, verify that this total equals the
sales volume variance.
6. Market size variance for the period.
7. Market share variance for the period.
8. The sum of the market size variance and market share variance. Also, verify that this total equals the
sales quantity variance.
Expert Solution
This question has been solved!
Explore an expertly crafted, step-by-step solution for a thorough understanding of key concepts.

Step by step
Solved in 2 steps with 2 images

Knowledge Booster


Learn more about
Need a deep-dive on the concept behind this application? Look no further. Learn more about this topic, accounting and related others by exploring similar questions and additional content below.Recommended textbooks for you
Cornerstones of Cost Management (Cornerstones Ser…
Accounting
ISBN:
9781305970663
Author:
Don R. Hansen, Maryanne M. Mowen
Publisher:
Cengage Learning
Cornerstones of Cost Management (Cornerstones Ser…
Accounting
ISBN:
9781305970663
Author:
Don R. Hansen, Maryanne M. Mowen
Publisher:
Cengage Learning