Carrier Value for the Dollar AT&T 3 AT&T 4 AT&T 4 AT&T 3 AT&T AT&T AT&T 533 AT&T 4 AT&T 4 Other 2 Sprint 5 Sprint 5 Sprint 5 Sprint 5 Verizon 3 Verizon 3 Verizon 3 Verizon 4 Verizon 5 AT&T 4 AT&T 2 AT&T 4 AT&T 4 AT&T AT&T AT&T AT&T AT&T AT&T 53 2333 AT&T 2 AT&T 4 Other 3 Other Other 33 Sprint Verizon 4 Verizon AT&T AT&T 4333 AT&T 3 Other 3 Other 3 Other 3 Other 4 Other T-mobile 34 T-mobile Verizon Verizon 4 3 2 Using the accompanying Cell Phone Survey data, apply ANOVA to determine if the mean response for value for the dollar is the same for different types of cell phones. Click the icon to view the Cell Phone Survey data. Determine the null hypothesis and the alternative hypothesis. Ho- P₁ = P2 =***P5 H₁: at least one mean is different from the others Find the F-test statistic. F = ☐ (Type an integer or decimal rounded to two decimal places as needed.)
Carrier Value for the Dollar AT&T 3 AT&T 4 AT&T 4 AT&T 3 AT&T AT&T AT&T 533 AT&T 4 AT&T 4 Other 2 Sprint 5 Sprint 5 Sprint 5 Sprint 5 Verizon 3 Verizon 3 Verizon 3 Verizon 4 Verizon 5 AT&T 4 AT&T 2 AT&T 4 AT&T 4 AT&T AT&T AT&T AT&T AT&T AT&T 53 2333 AT&T 2 AT&T 4 Other 3 Other Other 33 Sprint Verizon 4 Verizon AT&T AT&T 4333 AT&T 3 Other 3 Other 3 Other 3 Other 4 Other T-mobile 34 T-mobile Verizon Verizon 4 3 2 Using the accompanying Cell Phone Survey data, apply ANOVA to determine if the mean response for value for the dollar is the same for different types of cell phones. Click the icon to view the Cell Phone Survey data. Determine the null hypothesis and the alternative hypothesis. Ho- P₁ = P2 =***P5 H₁: at least one mean is different from the others Find the F-test statistic. F = ☐ (Type an integer or decimal rounded to two decimal places as needed.)

Survey of Accounting (Accounting I)
8th Edition
ISBN:9781305961883
Author:Carl Warren
Publisher:Carl Warren
Chapter11: Cost-volume-profit Analysis
Section: Chapter Questions
Problem 11.18E

Related questions
Question
What is the F- test statistic and p-value
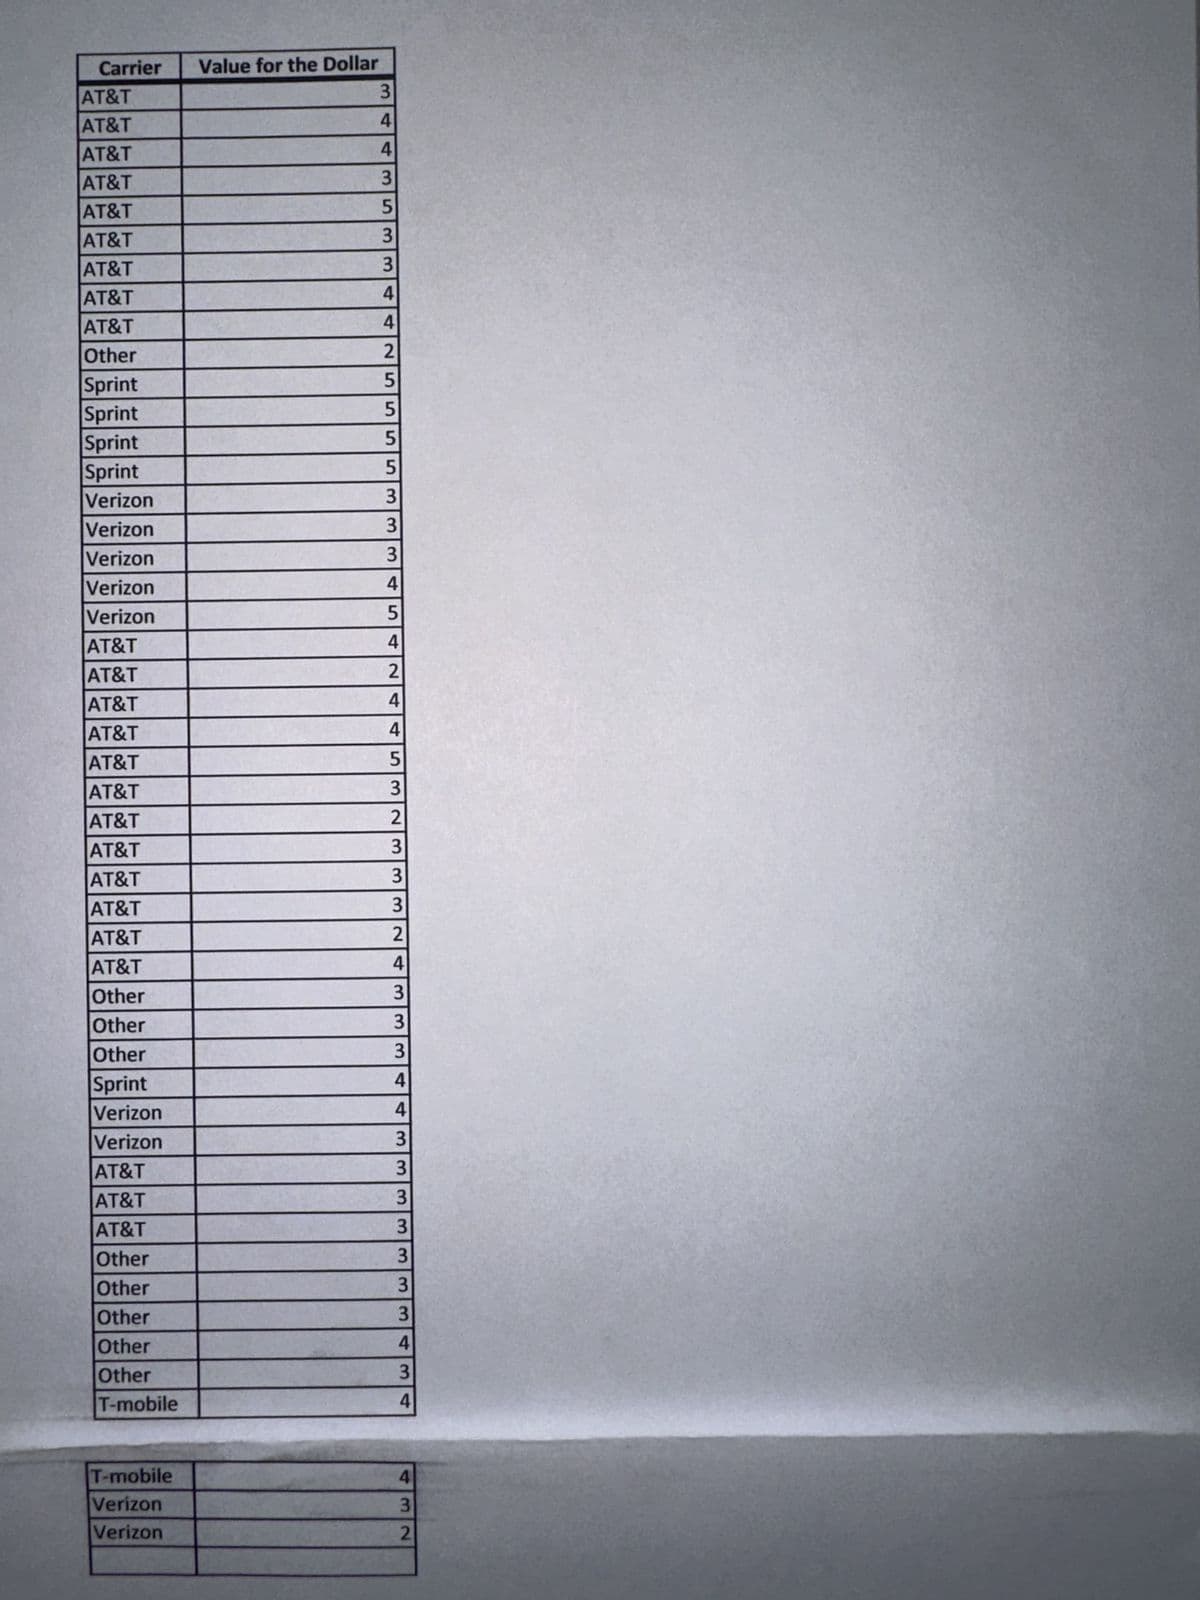
Transcribed Image Text:Carrier
Value for the Dollar
AT&T
3
AT&T
4
AT&T
4
AT&T
3
AT&T
AT&T
AT&T
533
AT&T
4
AT&T
4
Other
2
Sprint
5
Sprint
5
Sprint
5
Sprint
5
Verizon
3
Verizon
3
Verizon
3
Verizon
4
Verizon
5
AT&T
4
AT&T
2
AT&T
4
AT&T
4
AT&T
AT&T
AT&T
AT&T
AT&T
AT&T
53
2333
AT&T
2
AT&T
4
Other
3
Other
Other
33
Sprint
Verizon
4
Verizon
AT&T
AT&T
4333
AT&T
3
Other
3
Other
3
Other
3
Other
4
Other
T-mobile
34
T-mobile
Verizon
Verizon
4
3
2
Transcribed Image Text:Using the accompanying Cell Phone Survey data, apply ANOVA to determine if the mean response for value for the dollar is the same for different types of cell phones.
Click the icon to view the Cell Phone Survey data.
Determine the null hypothesis and the alternative hypothesis.
Ho-
P₁ = P2 =***P5
H₁: at least one mean is different from the others
Find the F-test statistic.
F = ☐
(Type an integer or decimal rounded to two decimal places as needed.)
Expert Solution
This question has been solved!
Explore an expertly crafted, step-by-step solution for a thorough understanding of key concepts.

Step by step
Solved in 1 steps with 3 images

Recommended textbooks for you
Survey of Accounting (Accounting I)
Accounting
ISBN:
9781305961883
Author:
Carl Warren
Publisher:
Cengage Learning
Survey of Accounting (Accounting I)
Accounting
ISBN:
9781305961883
Author:
Carl Warren
Publisher:
Cengage Learning