Case 1 Given the following financial statements historical ratios, and industry averages, calculate Sterling Company's financial ratios for the most recent year. (Assume a 365-day year.) Sterling Company Income Statement for the Year Ended December 31, 2012 Sales revenue $ 10,000,000 Less: Cost of Goods Sold Gross Profits Less: Operating expenses Selling expense General and administrative expens 7,500,000 2,500,000 300,000 650,000 Lease expense 50,000 Depreciation expense 200,000 Total operating expense Operating profits Less: Interest expense 1,200,000 1,300,000 200,000 Net profit before taxes 1,100,000 Less Taxes (rate - 40%) 440,000 Net profit after taxes 660,000 Less: Preferred stock dividends 50,000 Earnings available for common stockholders 610,000 Earnings per share Sterling Company Balance Sheet as of December 31, 2012 Assets Liabilities & Stockholders' Equtiy Cash 200.000 Accounte nauahle
Case 1 Given the following financial statements historical ratios, and industry averages, calculate Sterling Company's financial ratios for the most recent year. (Assume a 365-day year.) Sterling Company Income Statement for the Year Ended December 31, 2012 Sales revenue $ 10,000,000 Less: Cost of Goods Sold Gross Profits Less: Operating expenses Selling expense General and administrative expens 7,500,000 2,500,000 300,000 650,000 Lease expense 50,000 Depreciation expense 200,000 Total operating expense Operating profits Less: Interest expense 1,200,000 1,300,000 200,000 Net profit before taxes 1,100,000 Less Taxes (rate - 40%) 440,000 Net profit after taxes 660,000 Less: Preferred stock dividends 50,000 Earnings available for common stockholders 610,000 Earnings per share Sterling Company Balance Sheet as of December 31, 2012 Assets Liabilities & Stockholders' Equtiy Cash 200.000 Accounte nauahle

Corporate Financial Accounting
14th Edition
ISBN:9781305653535
Author:Carl Warren, James M. Reeve, Jonathan Duchac
Publisher:Carl Warren, James M. Reeve, Jonathan Duchac
Chapter14: Financial Statement Analysis
Section: Chapter Questions
Problem 14.1EX: Vertical analysis of income statement Revenue and expense data for Innovation Quarter Inc. for two...

Related questions
Question
Notes:
a. The firm has an 8-year financial lease requiring annual beginning-of-year payments of $50,000. Five years of the lease have yet to run.
b. Annual credit purchases of $6,200,000 were made during the year.
c. The annual principal payment on the long-term debt is $100,000.
d. On December 31, 2012, the firm’s common stock closed at $39.50 per share.
Question:
1. What is the operating profit margin?
2. What is the net profit margin? (use earnings available for common stockholders)
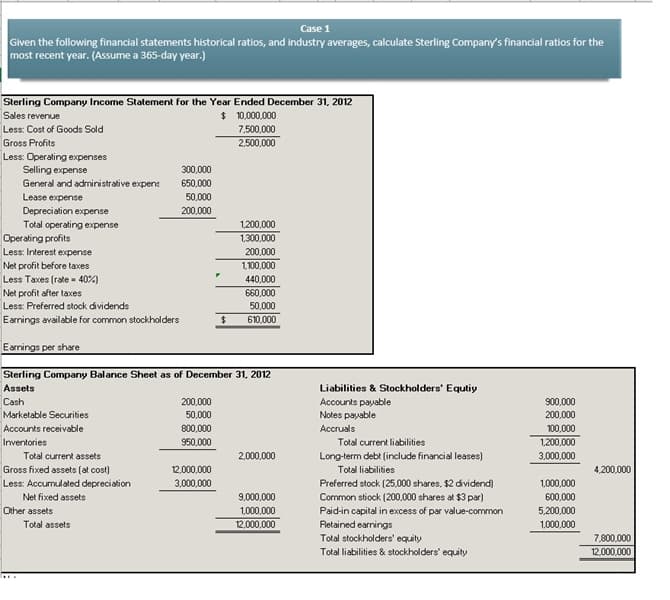
Transcribed Image Text:Case 1
Given the following financial statements historical ratios, and industry averages, calculate Sterling Company's financial ratios for the
most recent year. (Assume a 365-day year.)
Sterling Company Income Statement for the Year Ended December 31, 2012
$ 10,000,000
7,500,000
Sales revenue
Less: Cost of Goods Sold
Gross Profits
2,500,000
Less: Operating expenses
Selling expense
General and administrative expens
300,000
650,000
Lease expense
50,000
Depreciation expense
Total operating expense
200,000
1,200,000
Operating profits
1,300,000
200,000
Less: Interest expense
Net profit before taxes
1,100,000
Less Taxes (rate - 40%)
440,000
Net profit after taxes
Less: Preferred stock dividends
660,000
50,000
Earnings available for common stockholders
24
610,000
Earnings per share
Sterling Company Balance Sheet as of December 31, 2012
Assets
Liabilities & Stockholders' Equtiy
Cash
200,000
Accounts payable
Notes payable
900,000
Marketable Securities
50,000
200,000
Accounts receivable
800,000
Accruals
100,000
Inventories
950,000
Total current liabilities
1,200,000
Total current assets
2.000,000
Long-term debt (include financial leases)
Total liabilities
3,000,000
Gross fixed assets (at cost)
12,000,000
4,200,000
Less: Accumulated depreciation
3,000,000
Preferred stock (25,000 shares, $2 dividend)
1,000,000
Net fixed assets
9,000,000
Common stiock (200,000 shares at $3 par)
Paid-in capital in excess of par value-common
600,000
Other assets
1,000,000
5,200,000
Total assets
12,000,000
Retained earrings
Total stockholders' equity
Total liabilities & stockholders' equity
1,000,000
7,800,000
12,000,000
Expert Solution
This question has been solved!
Explore an expertly crafted, step-by-step solution for a thorough understanding of key concepts.

This is a popular solution!

Trending now
This is a popular solution!

Step by step
Solved in 2 steps

Knowledge Booster


Learn more about
Need a deep-dive on the concept behind this application? Look no further. Learn more about this topic, finance and related others by exploring similar questions and additional content below.Recommended textbooks for you
Corporate Financial Accounting
Accounting
ISBN:
9781305653535
Author:
Carl Warren, James M. Reeve, Jonathan Duchac
Publisher:
Cengage Learning

Managerial Accounting
Accounting
ISBN:
9781337912020
Author:
Carl Warren, Ph.d. Cma William B. Tayler
Publisher:
South-Western College Pub

Financial Accounting
Accounting
ISBN:
9781305088436
Author:
Carl Warren, Jim Reeve, Jonathan Duchac
Publisher:
Cengage Learning
Corporate Financial Accounting
Accounting
ISBN:
9781305653535
Author:
Carl Warren, James M. Reeve, Jonathan Duchac
Publisher:
Cengage Learning
Managerial Accounting
Accounting
ISBN:
9781337912020
Author:
Carl Warren, Ph.d. Cma William B. Tayler
Publisher:
South-Western College Pub
Financial Accounting
Accounting
ISBN:
9781305088436
Author:
Carl Warren, Jim Reeve, Jonathan Duchac
Publisher:
Cengage Learning

Financial Accounting
Accounting
ISBN:
9781337272124
Author:
Carl Warren, James M. Reeve, Jonathan Duchac
Publisher:
Cengage Learning

Financial Accounting: The Impact on Decision Make…
Accounting
ISBN:
9781305654174
Author:
Gary A. Porter, Curtis L. Norton
Publisher:
Cengage Learning

Survey of Accounting (Accounting I)
Accounting
ISBN:
9781305961883
Author:
Carl Warren
Publisher:
Cengage Learning