Case 2 Comparative financial statements for Weller Corporation for the fi scal year ending December 31 appear below. The company did not issue any new common or preferred stock during the year. A total of 800,000 shares of common stock were outstanding, The interest rate on the bond payable was 12%, the income tax rate was 40%, and the dividend per share of common stock was $0.25. The market value of the company's common stock at the end of the year was $18. All of the company's sales are on account. Use 365 days for the ratios. Weller Corporation Weller Corporation Comparative Balance Sheet (dollars in thousands) Comparative Income Statement and Reconciliation (dollars in thousands) This Year Last Year This Year Last Year Assets Sales 79,000 74,000 Current assets: Cost of goods sold 52,000 48,000 Gross margin 1280 12.300 9,700 Cash 1560 9,100 8,200 27,000 26.000 Accounts, receivable, net Selling and administrative expenses: Selling expenses Administrative expenses Total selling & admin. expenses Net operating income Interest expense Net income before taxes Income taxes (40%) Net income Inventory Prepaid expenses Total current assets 1800 2,100 8,500 8,000 25.080 20,960 12,000 11.000 20,500 6,500 600 5.900 19,000 7,000 600 Property and equipment Land 6.000 19,000 6.000 Buldngs and equipment, net Total property and equipment Total assets 19.200 6,400 25,200 50,280 25,000 45,960 2,360 3,540 2,560 3,840 Dividends to preferred stockholders 120 3,420 200 3,220 400 Liabilities & Stockholders' Equity Net income remaining for common stockholdert 3,440 Current liabilities: Dividend to common stockholders Net income added to retained earnings Retained earnings, beginning of the year Retained earnings, end of the year 200 Accounts payable Accrued payables Notes payable, short term 9,500 8,300 3,240 600 300 700 300 26,660 23,420 26.660 29,880 Total current liabilities 10,400 9,300 Long-term liabilities Bonds payable Total liabilities 5,000 14,300 5,000 15,400 Stockholders' equity Preferred stock 2.000 2,000 Common stock Additional paid-in capital Total paid-in capital Petained E arnings Total stockholders' equity Total liabilities & stockholders' equily 800 800 2.200 2,200 5,000 26.660 31.660 5,000 29,880 34,80 50,280 45,960
Case 2 Comparative financial statements for Weller Corporation for the fi scal year ending December 31 appear below. The company did not issue any new common or preferred stock during the year. A total of 800,000 shares of common stock were outstanding, The interest rate on the bond payable was 12%, the income tax rate was 40%, and the dividend per share of common stock was $0.25. The market value of the company's common stock at the end of the year was $18. All of the company's sales are on account. Use 365 days for the ratios. Weller Corporation Weller Corporation Comparative Balance Sheet (dollars in thousands) Comparative Income Statement and Reconciliation (dollars in thousands) This Year Last Year This Year Last Year Assets Sales 79,000 74,000 Current assets: Cost of goods sold 52,000 48,000 Gross margin 1280 12.300 9,700 Cash 1560 9,100 8,200 27,000 26.000 Accounts, receivable, net Selling and administrative expenses: Selling expenses Administrative expenses Total selling & admin. expenses Net operating income Interest expense Net income before taxes Income taxes (40%) Net income Inventory Prepaid expenses Total current assets 1800 2,100 8,500 8,000 25.080 20,960 12,000 11.000 20,500 6,500 600 5.900 19,000 7,000 600 Property and equipment Land 6.000 19,000 6.000 Buldngs and equipment, net Total property and equipment Total assets 19.200 6,400 25,200 50,280 25,000 45,960 2,360 3,540 2,560 3,840 Dividends to preferred stockholders 120 3,420 200 3,220 400 Liabilities & Stockholders' Equity Net income remaining for common stockholdert 3,440 Current liabilities: Dividend to common stockholders Net income added to retained earnings Retained earnings, beginning of the year Retained earnings, end of the year 200 Accounts payable Accrued payables Notes payable, short term 9,500 8,300 3,240 600 300 700 300 26,660 23,420 26.660 29,880 Total current liabilities 10,400 9,300 Long-term liabilities Bonds payable Total liabilities 5,000 14,300 5,000 15,400 Stockholders' equity Preferred stock 2.000 2,000 Common stock Additional paid-in capital Total paid-in capital Petained E arnings Total stockholders' equity Total liabilities & stockholders' equily 800 800 2.200 2,200 5,000 26.660 31.660 5,000 29,880 34,80 50,280 45,960

Intermediate Accounting: Reporting And Analysis
3rd Edition
ISBN:9781337788281
Author:James M. Wahlen, Jefferson P. Jones, Donald Pagach
Publisher:James M. Wahlen, Jefferson P. Jones, Donald Pagach
Chapter16: Retained Earnings And Earnings Per Share
Section: Chapter Questions
Problem 12RE: Given the following year-end information, compute Greenwood Corporations basic and diluted earnings...

Related questions
Question
13. Accounts receivable turnover (assume all sales are on account)
14. Average collection period
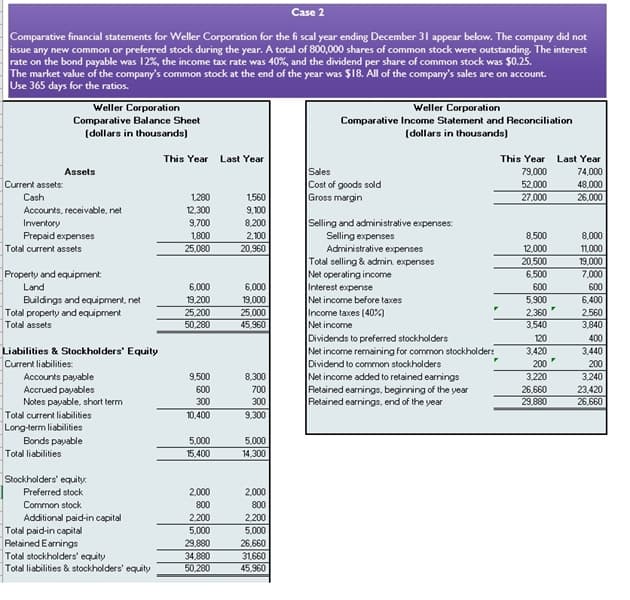
Transcribed Image Text:Case 2
Comparative financial statements for Weller Corporation for the fi scal year ending December 31 appear below. The company did not
issue any new common or preferred stock during the year. A total of 800,000 shares of common stock were outstanding. The interest
rate on the bond payable was 12%, the income tax rate was 40%, and the dividend per share of common stock was $0.25.
The market value of the company's common stock at the end of the year was $18. All of the company's sales are on account.
Use 365 days for the ratios.
Weller Corporation
Weller Corporation
Comparative Balance Sheet
Comparative Income Statement and Reconciliation
(dollars in thousands)
(dollars in thousands)
This Year Last Year
This Year Last Year
Sales
Cost of goods sold
Gross margin
Assets
79,000
74,000
Current assets:
52,000
27,000
48,000
Cash
1280
1560
26,000
12,300
9,700
Accounts, receivable, net
9,100
Selling and administrative expenses:
Selling expenses
Administrative expenses
Total selling & admin. expenses
Net operating income
Interest expense
Net income before taxes
Income taxes (40%)
Net income
Dividends to preferred stockholders
Net income remaining for common stockholder:
Dividend to common stockholders
Net income added to retained earnings
Retained earnings, beginning of the year
Retained earnings, end of the year
Inventory
8,200
Prepaid expenses
1,800
2,100
8,500
12.000
20,500
8,000
Total current assets
25,080
20,960
1,000
19,000
Property and equipment
Land
6,500
7,000
6,000
6,000
600
600
Buildings and equipment, net
Total property and equipment
Total assets
19,200
19,000
5,900
6,400
25,200
50,280
25,000
45,960
2,360
3,540
2,560
3,840
120
400
Liabilities & Stockholders' Equity
Current liabilities:
Accounts payable
3,420
3,440
200
200
9,500
8,300
3,220
3,240
Accrued payables
Notes payable, short term
600
700
26,660
29,880
23,420
26,660
300
300
Total current liabilities
Long-term liabilities
10,400
9,300
5,000
Bonds payable
Total liabilities
5,000
15,400
14,300
Stockholders' equity:
Preferred stock
2,000
2,000
Common stock
800
Additional paid-in capital
Total paid-in capital
Retained Earnings
Total stockholders' equity
Total liabilities & stockholders' equity
800
2,200
5,000
26,660
31.660
45,960
2.200
5,000
29,880
34,880
50,280
Expert Solution
This question has been solved!
Explore an expertly crafted, step-by-step solution for a thorough understanding of key concepts.

Step by step
Solved in 2 steps

Recommended textbooks for you
Intermediate Accounting: Reporting And Analysis
Accounting
ISBN:
9781337788281
Author:
James M. Wahlen, Jefferson P. Jones, Donald Pagach
Publisher:
Cengage Learning

Managerial Accounting
Accounting
ISBN:
9781337912020
Author:
Carl Warren, Ph.d. Cma William B. Tayler
Publisher:
South-Western College Pub

Intermediate Accounting: Reporting And Analysis
Accounting
ISBN:
9781337788281
Author:
James M. Wahlen, Jefferson P. Jones, Donald Pagach
Publisher:
Cengage Learning
Managerial Accounting
Accounting
ISBN:
9781337912020
Author:
Carl Warren, Ph.d. Cma William B. Tayler
Publisher:
South-Western College Pub
Principles of Accounting Volume 1
Accounting
ISBN:
9781947172685
Author:
OpenStax
Publisher:
OpenStax College