Ch 8 Do We Achieve? A local school district recently implemented an experimental program to improve mathematical skills for a specific high risk population. They selected 15 students to be in the initial study. After 1 year, the students in the program took a national mathematic achievement test. Students in this high risk population score an average of 35 with a standard deviation of 6. The goal of the program is for students to increase performance. Assume the data is approximately normally distributed. The scores the students received are listed below. 40 55 50 30 33 44 25 15 53 40 65 13 58 69 78 The program is using a 5% significance level to report its results. Directions Answer the following questions: 1. Determine and state the mean and standard deviation for the data set. 2. State the alternative hypothesis. 3. State which hypothesis test you would use (Z Test, T Test, 1 Proportion).
Ch 8 Do We Achieve? A local school district recently implemented an experimental program to improve mathematical skills for a specific high risk population. They selected 15 students to be in the initial study. After 1 year, the students in the program took a national mathematic achievement test. Students in this high risk population score an average of 35 with a standard deviation of 6. The goal of the program is for students to increase performance. Assume the data is approximately normally distributed. The scores the students received are listed below. 40 55 50 30 33 44 25 15 53 40 65 13 58 69 78 The program is using a 5% significance level to report its results. Directions Answer the following questions: 1. Determine and state the mean and standard deviation for the data set. 2. State the alternative hypothesis. 3. State which hypothesis test you would use (Z Test, T Test, 1 Proportion).

MATLAB: An Introduction with Applications
6th Edition
ISBN:9781119256830
Author:Amos Gilat
Publisher:Amos Gilat
Chapter1: Starting With Matlab
Section: Chapter Questions
Problem 1P

Related questions
Question
Please explain in de
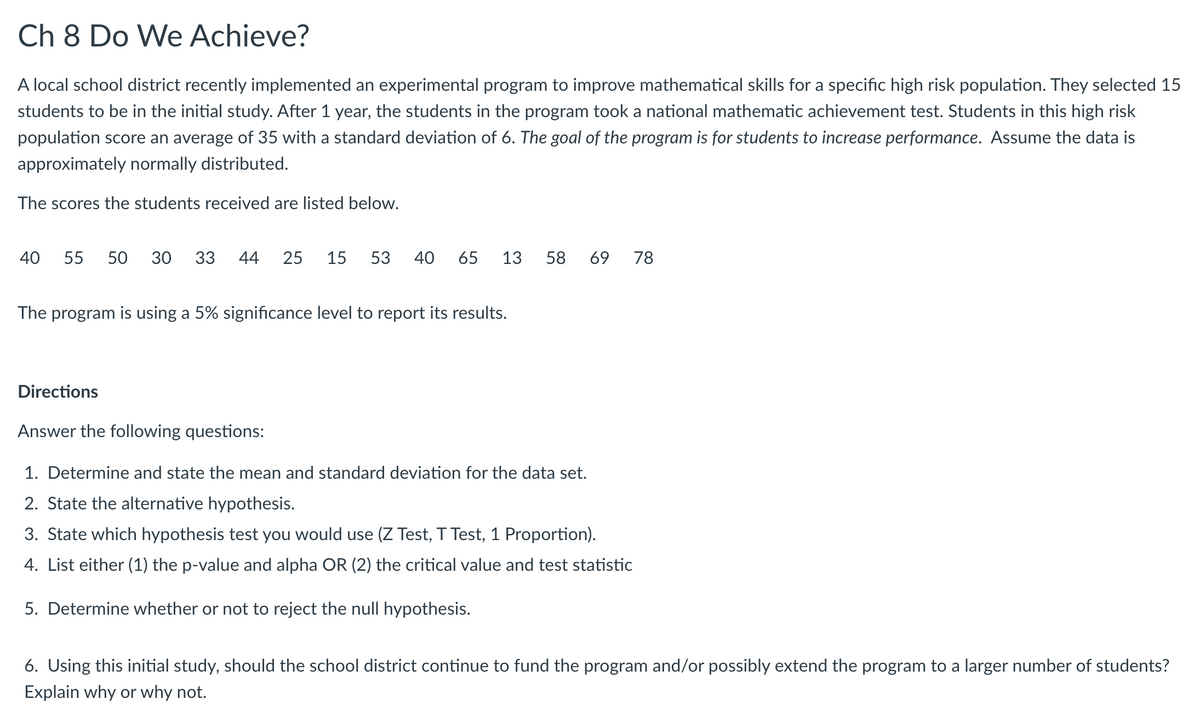
Transcribed Image Text:Ch 8 Do We Achieve?
A local school district recently implemented an experimental program to improve mathematical skills for a specific high risk population. They selected 15
students to be in the initial study. After 1 year, the students in the program took a national mathematic achievement test. Students in this high risk
population score an average of 35 with a standard deviation of 6. The goal of the program is for students to increase performance. Assume the data is
approximately normally distributed.
The scores the students received are listed below.
40 55 50 30 33 44 25 15 53 40 65 13 58 69 78
The program is using a 5% significance level to report its results.
Directions
Answer the following questions:
1. Determine and state the mean and standard deviation for the data set.
2. State the alternative hypothesis.
3. State which hypothesis test you would use (Z Test, T Test, 1 Proportion).
4. List either (1) the p-value and alpha OR (2) the critical value and test statistic
5. Determine whether or not to reject the null hypothesis.
6. Using this initial study, should the school district continue to fund the program and/or possibly extend the program to a larger number of students?
Explain why or why not.
Expert Solution
This question has been solved!
Explore an expertly crafted, step-by-step solution for a thorough understanding of key concepts.

Step by step
Solved in 4 steps with 3 images

Recommended textbooks for you
MATLAB: An Introduction with Applications
Statistics
ISBN:
9781119256830
Author:
Amos Gilat
Publisher:
John Wiley & Sons Inc

Probability and Statistics for Engineering and th…
Statistics
ISBN:
9781305251809
Author:
Jay L. Devore
Publisher:
Cengage Learning

Statistics for The Behavioral Sciences (MindTap C…
Statistics
ISBN:
9781305504912
Author:
Frederick J Gravetter, Larry B. Wallnau
Publisher:
Cengage Learning
MATLAB: An Introduction with Applications
Statistics
ISBN:
9781119256830
Author:
Amos Gilat
Publisher:
John Wiley & Sons Inc
Probability and Statistics for Engineering and th…
Statistics
ISBN:
9781305251809
Author:
Jay L. Devore
Publisher:
Cengage Learning
Statistics for The Behavioral Sciences (MindTap C…
Statistics
ISBN:
9781305504912
Author:
Frederick J Gravetter, Larry B. Wallnau
Publisher:
Cengage Learning

Elementary Statistics: Picturing the World (7th E…
Statistics
ISBN:
9780134683416
Author:
Ron Larson, Betsy Farber
Publisher:
PEARSON

The Basic Practice of Statistics
Statistics
ISBN:
9781319042578
Author:
David S. Moore, William I. Notz, Michael A. Fligner
Publisher:
W. H. Freeman

Introduction to the Practice of Statistics
Statistics
ISBN:
9781319013387
Author:
David S. Moore, George P. McCabe, Bruce A. Craig
Publisher:
W. H. Freeman