Chapin Manufacturing Company operates 24 hours a day, five days a week. The workers rotate shifts each week. Management is interested in whether there is a difference in the number of units produced when the employees work on various shifts. A sample of five workers is selected and their output recorded on each shift and located in the table below (and in the data file link). Assume units produced are normally distributed. Afternoon Day 31 Night 37 Skaff 33 Lum 20 26 30 Clark 36 34 38 Treece 26 30 24 Morgan 13 25 29 Click here for the Excel data file a-1. Construct an ANOVA table. (Round intermediate calculations to at least 4 decimal places. Round "SS", "MS", "p-value", and "F" to 4 decimal places.) ANOVA p-value Source of Variation df MS F Factor B Factor A Error Total a-2. At the 5% significance level, can you conclude that the average number of units produced differ by employee? OYes, since the p-value for employee is less than the significance level. OYes, since the p-value for employee is greater than the significance level. ONo, since the p-value for employee is less than the significance level. ONo, since the p-value for employee is greater than the significance level. b. At the 5% significance level, can you conclude that average units produced differ by shift? OYes, since the p-value for shift is less than the significance level. OYes, since the p-value for shift is greater than the significance level. ONo, since the p-value for shift is less than the significance level. ONo, since the p-value for shift is greater than the significance level.
Chapin Manufacturing Company operates 24 hours a day, five days a week. The workers rotate shifts each week. Management is interested in whether there is a difference in the number of units produced when the employees work on various shifts. A sample of five workers is selected and their output recorded on each shift and located in the table below (and in the data file link). Assume units produced are normally distributed. Afternoon Day 31 Night 37 Skaff 33 Lum 20 26 30 Clark 36 34 38 Treece 26 30 24 Morgan 13 25 29 Click here for the Excel data file a-1. Construct an ANOVA table. (Round intermediate calculations to at least 4 decimal places. Round "SS", "MS", "p-value", and "F" to 4 decimal places.) ANOVA p-value Source of Variation df MS F Factor B Factor A Error Total a-2. At the 5% significance level, can you conclude that the average number of units produced differ by employee? OYes, since the p-value for employee is less than the significance level. OYes, since the p-value for employee is greater than the significance level. ONo, since the p-value for employee is less than the significance level. ONo, since the p-value for employee is greater than the significance level. b. At the 5% significance level, can you conclude that average units produced differ by shift? OYes, since the p-value for shift is less than the significance level. OYes, since the p-value for shift is greater than the significance level. ONo, since the p-value for shift is less than the significance level. ONo, since the p-value for shift is greater than the significance level.

Holt Mcdougal Larson Pre-algebra: Student Edition 2012
1st Edition
ISBN:9780547587776
Author:HOLT MCDOUGAL
Publisher:HOLT MCDOUGAL
Chapter11: Data Analysis And Probability
Section: Chapter Questions
Problem 8CR

Related questions
Question
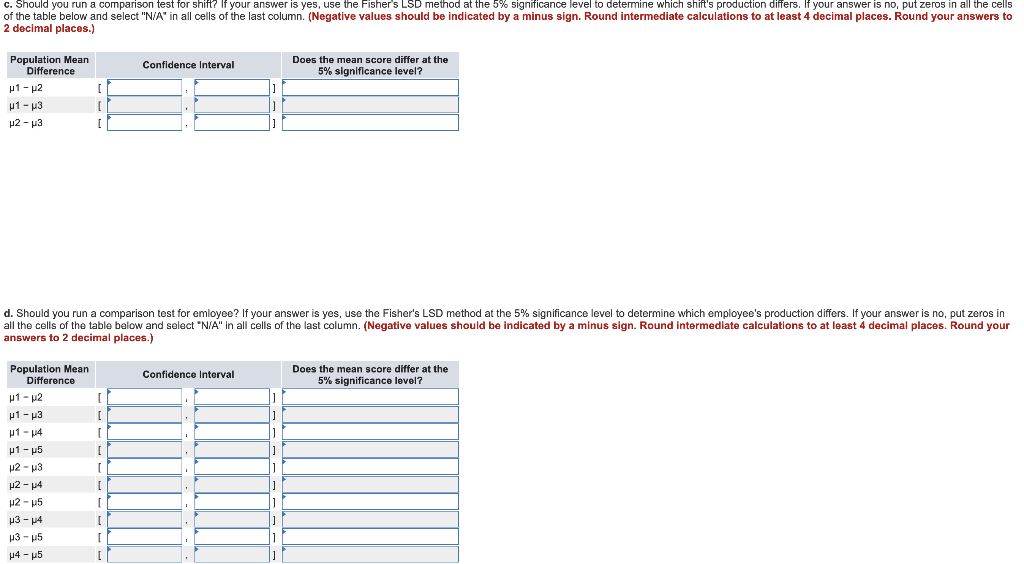
Transcribed Image Text:c. Should you run a comparison test for shift? If your answer is yes, use the Fisher's LSD method at the 5% significance level to determine which shift's production differs. If your answer is no, put zeros in all the cells
of the table below and select "N/A" in all cells of the last column. (Negative values should be indicated by a minus sign. Round intermediate calculations to at least 4 decimal places. Round your answers
2 decimal places.)
Population Mean
Difference
Does the mean score differ at the
5% significance level?
Confidence Interval
p1- p2
u1- u3
µ2 - p3
d. Should you run a comparison test for emloyee? If your answer is yes, use the Fisher's LSD method at the 5% significance level to determine which employee's production differs. If your answer is no, put zeros in
all the cells of the table below and select "N/A" in all cells of the last column. (Negative values should be indicated by a minus sign. Round intermediate calculations to at least 4 decimal places. Round your
answers to 2 decimal places.)
Population Mean
Difference
Does the mean score differ at the
Confidence Interval
5% significance level?
u1 - p2
p1 - p3
u1 - 14
p1 - p5
µ2 - u3
u2 - p4
µ2 - p5
p3 - p4
p3 - u5
p4 - p5
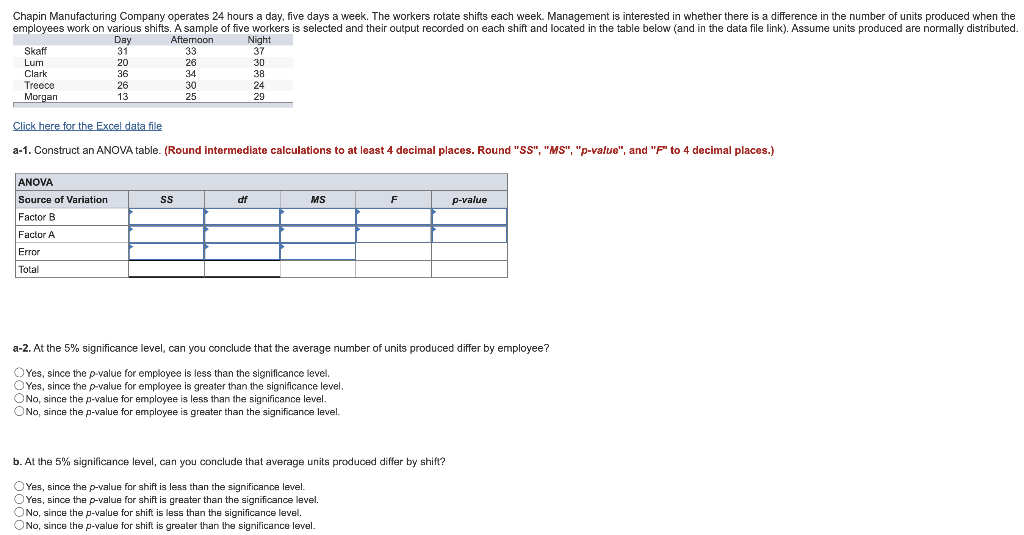
Transcribed Image Text:Chapin Manufacturing Company operates 24 hours a day, five days a week. The workers rotate shifts each week. Management is interested in whether there is a difference in the number of units produced when the
employees work on various shifts. A sample of five workers is selected and their output recorded on each shift and located in the table below (and in the data file link). Assume units produced are normally distributed.
Day
31
Afternoon
33
Night
37
Skaff
Lum
20
26
30
Clark
Treece
Morgan
36
34
38
26
30
24
13
25
29
Click here for the Excel data file
a-1. Construct an ANOVA table. (Round intermediate calculations to at least 4 decimal places. Round "SS", "MS", "p-value", and "F" to 4 decimal places.)
ANOVA
Source of Variation
Ss
df
MS
F
р-value
Factor B
Factor A
Error
Total
a-2. At the 5% significance level, can you conclude that the average number of units produced differ by employee?
OYes, since the p-value for employee is less than the significance level.
OYes, since the p-value for employee is greater than the significance level.
ONo, since the p-value for employee is less than the significance level.
ONo, since the p-value for employee is greater than the significance level.
b. At the 5% significance level, can you conclude that average units produced differ by shift?
OYes, since the p-value for shift is less than the significance level.
OYes, since the p-value for shift is greater than the significance level.
ONo, since the p-value for shift is less than the significance level.
ONo, since the p-value for shift is greater than the significance level.
Expert Solution
This question has been solved!
Explore an expertly crafted, step-by-step solution for a thorough understanding of key concepts.

This is a popular solution!

Trending now
This is a popular solution!

Step by step
Solved in 4 steps

Recommended textbooks for you
Holt Mcdougal Larson Pre-algebra: Student Edition…
Algebra
ISBN:
9780547587776
Author:
HOLT MCDOUGAL
Publisher:
HOLT MCDOUGAL

Glencoe Algebra 1, Student Edition, 9780079039897…
Algebra
ISBN:
9780079039897
Author:
Carter
Publisher:
McGraw Hill

College Algebra (MindTap Course List)
Algebra
ISBN:
9781305652231
Author:
R. David Gustafson, Jeff Hughes
Publisher:
Cengage Learning
Holt Mcdougal Larson Pre-algebra: Student Edition…
Algebra
ISBN:
9780547587776
Author:
HOLT MCDOUGAL
Publisher:
HOLT MCDOUGAL
Glencoe Algebra 1, Student Edition, 9780079039897…
Algebra
ISBN:
9780079039897
Author:
Carter
Publisher:
McGraw Hill
College Algebra (MindTap Course List)
Algebra
ISBN:
9781305652231
Author:
R. David Gustafson, Jeff Hughes
Publisher:
Cengage Learning