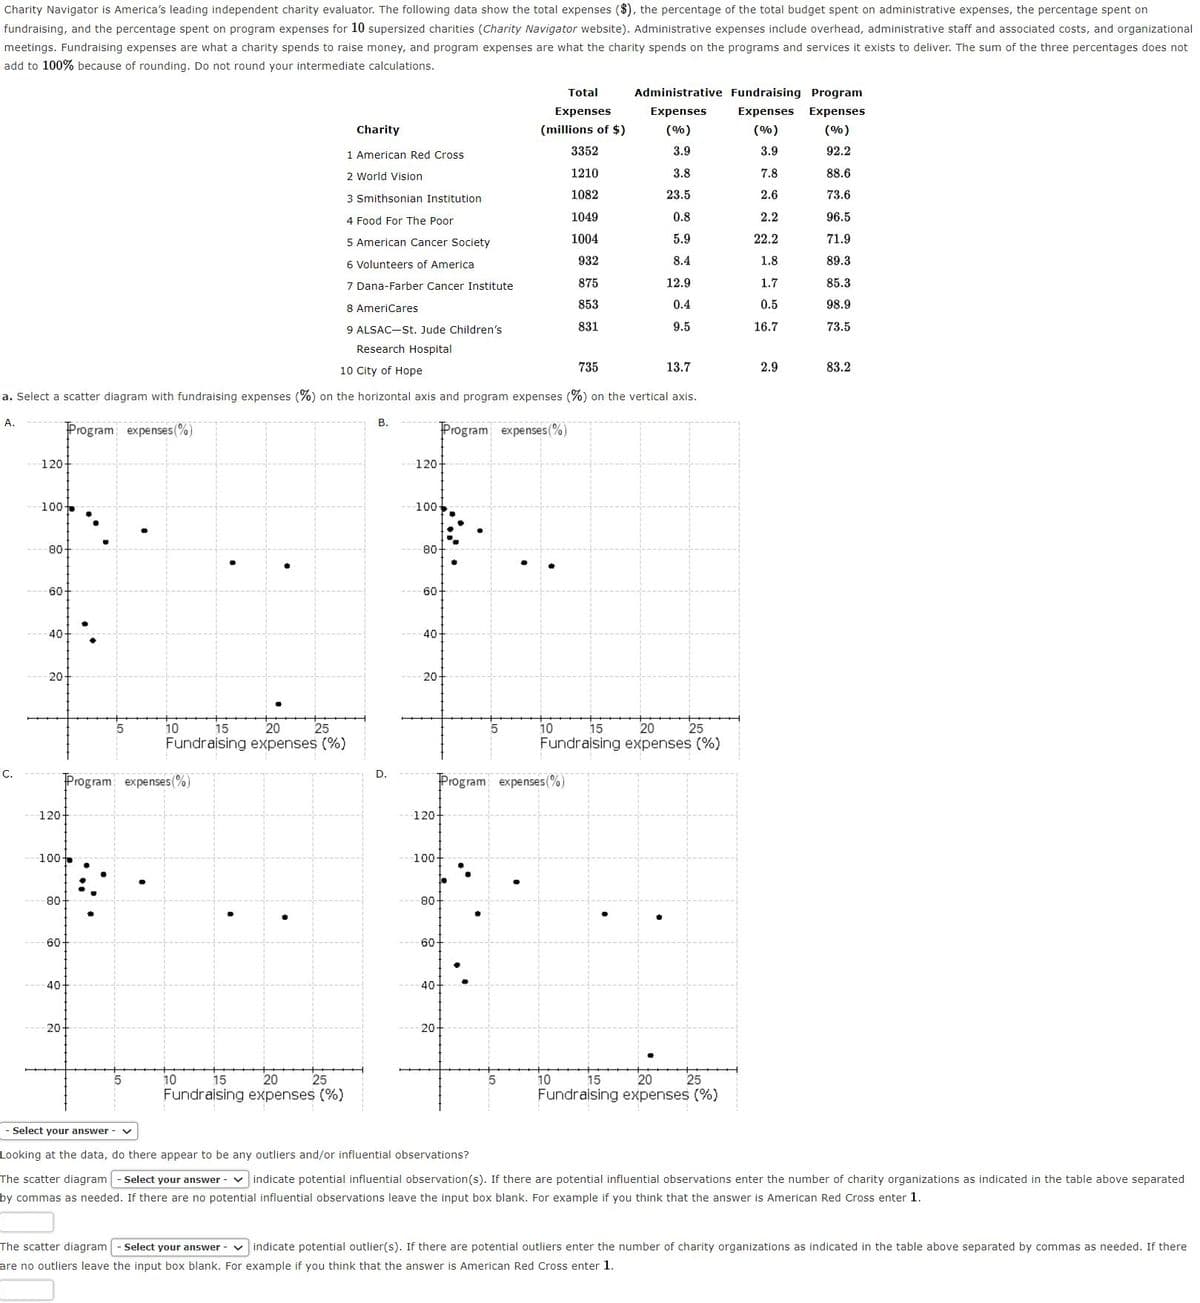
Charity Navigator is America's leading independent charity evaluator. The following data show the total expenses ($), the percentage of the total budget spent on administrative expenses, the percentage spent on fundraising, and the percentage spent on program expenses for 10 supersized charities (Charity Navigator website). Administrative expenses include overhead, administrative staff and associated costs, and organizational meetings. Fundraising expenses are what a charity spends to raise money, and program expenses are what the charity spends on the programs and services it exists to deliver. The sum of the three percentages does not add to 100% because of rounding. Do not round your intermediate calculations. Total Administrative Fundraising Program Expenses Expenses Expenses Expenses Charity (millions of $) (%) (%) (%) 1 American Red Cross 3352 3.9 3.9 92.2 2 World Vision 1210 3.8 7.8 88.6 3 Smithsonian Institution 1082 23.5 2.6 73.6 4 Food For The Poor 1049 0.8 2.2 96.5 5 American Cancer Society 1004 5.9 22.2 71.9 6 Volunteers of America 932 8.4 1.8 89.3 7 Dana-Farber Cancer Institute 875 12.9 1.7 85.3 8 AmeriCares 853 0.4 0.5 98.9 9 ALSAC-St. Jude Children's 831 9.5 16.7 73.5 Research Hospital 10 City of Hope 735 13.7 2.9 83.2 a. Select a scatter diagram with fundraising expenses (%) on the horizontal axis and program expenses (%) on the vertical axis. A. В. Program expenses(%) Program expenses(%) 120- 120- 100늘 100 80 80 60 60 40. 40- 20- 20- 20 Fundraising expenses (%) 15 25 10 20 Fundraising expenses (%) 10 15 25 C. Program expenses(%) Program expenses(%) 120- 120- 100 100- 80- 80- 60- 60 40- 40- 20 20 25 10 15 20 Fundraising expenses (%) 15 20 Fundraising expenses (%) 10 25 - Select your answer- v Looking at the data, do there appear to be any outliers and/or influential observations? The scatter diagram - Select your answer - v indicate potential influential observation(s). If there are potential influential observations enter the number of charity organizations as indicated in the table above separated by commas as needed. If there are no potential influential observations leave the input box blank. For example if you think that the answer American Red Cross enter 1. The scatter diagram - Select your answer - v indicate potential outlier(s). If there are potential outliers enter the number of charity organizations as indicated in the table above separated by commas as needed. If there are no outliers leave the input box blank. For example if you think that the answer is American Red Cross enter 1.


-select your answer choices-
a) correct
The scatter diagram (does, does not) indicate potential influential observation(s). If there are potential influential observations enter the number of charity organizations as indicated in the table above separated by commas as needed. If there are no potential observations leave the input box blank. For example if you think that the answer is American Red Cross enter 1.
The scatter diagram (does, does not) indicate potential outlier(s). If there are potential outliers enter the number of charity organizations as indicated in the table above separated by commas as needed. If there are no outliers leave the input box blank. For example if you think that the answer is American Red Cross enter 1.
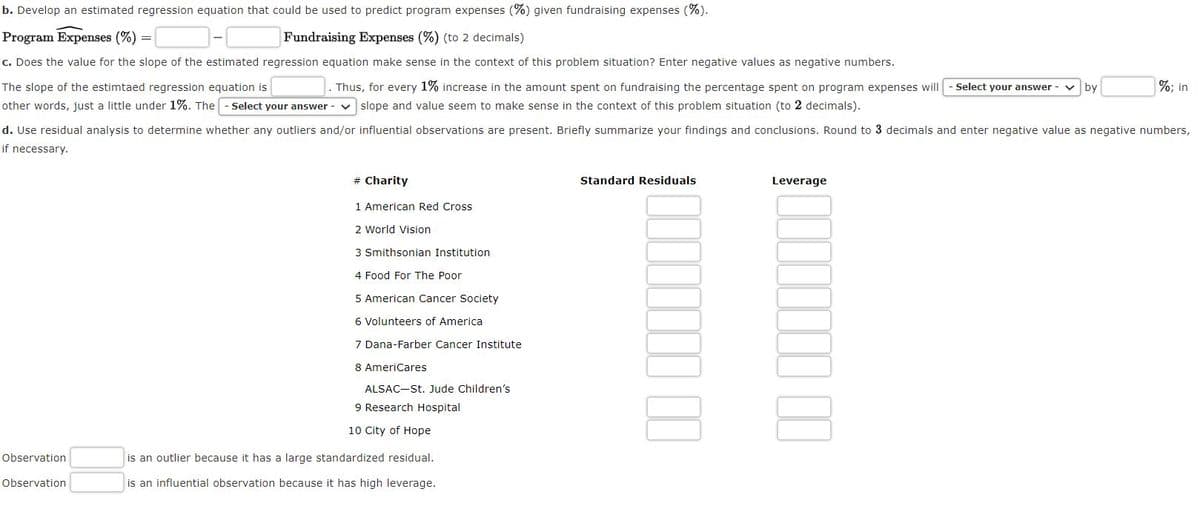
c) The slope of the estimated regression equation is __. Thus, for every 1% increase in the amount spent on fundraising the percentage spent on program expenses will (increase, decrease) by __%; in other words, just a little under 1%. The (negative, positive) slope and value seem to make sense in the context of this problem situation (to 2 decimals).

Step by step
Solved in 4 steps with 8 images


