charity Navigator is America's leading independent charity evaluator. The following data show the total expenses ($), the percentage of the total budget spent on administrative expenses, the ercentage spent on fundraising, and the percentage spent on program expenses for 10 supersized charities (Charity Navigator website). Administrative expenses include overhead, administrative taff and associated costs, and organizational meetings. Fundraising expenses are what a charity spends to raise money, and program expenses are what the charity spends on the programs and ervices it exists to deliver. The sum of the three percentages does not add to 100% because of rounding. Do not round your intermediate calculations. Total Administrative Fundraising Program Expenses Expenses Expenses Expenses Charity (millions of $) (%) (%) (%) 1 American Red Cross 3352 3.9 3.9 92.3 2 World Vision 1205 4.1 7.5 88.3 3 Smithsonian Institution 1082 23.4 2.6 73.9 4 Food For The Poor 1048 0.5 2.3 96.9 5 American Cancer Society 1001 5.8 22.3 71.5 6 Volunteers of America 927 8.7 1.7 89.6 7 Dana-Farber Cancer Institute 878 12.9 1.4 85.0 8 AmeriCares 855 0.4 0.8 98.6 9 ALSAC-St. Jude Children's 827 9.4 16.8 73.6 Research Hospital 10 City of Hope 735 13.9 3.1 83.0 . Select a scatter diagram with fundraising expenses (%) on the horizontal axis and program expenses (%) on the vertical axis.
charity Navigator is America's leading independent charity evaluator. The following data show the total expenses ($), the percentage of the total budget spent on administrative expenses, the ercentage spent on fundraising, and the percentage spent on program expenses for 10 supersized charities (Charity Navigator website). Administrative expenses include overhead, administrative taff and associated costs, and organizational meetings. Fundraising expenses are what a charity spends to raise money, and program expenses are what the charity spends on the programs and ervices it exists to deliver. The sum of the three percentages does not add to 100% because of rounding. Do not round your intermediate calculations. Total Administrative Fundraising Program Expenses Expenses Expenses Expenses Charity (millions of $) (%) (%) (%) 1 American Red Cross 3352 3.9 3.9 92.3 2 World Vision 1205 4.1 7.5 88.3 3 Smithsonian Institution 1082 23.4 2.6 73.9 4 Food For The Poor 1048 0.5 2.3 96.9 5 American Cancer Society 1001 5.8 22.3 71.5 6 Volunteers of America 927 8.7 1.7 89.6 7 Dana-Farber Cancer Institute 878 12.9 1.4 85.0 8 AmeriCares 855 0.4 0.8 98.6 9 ALSAC-St. Jude Children's 827 9.4 16.8 73.6 Research Hospital 10 City of Hope 735 13.9 3.1 83.0 . Select a scatter diagram with fundraising expenses (%) on the horizontal axis and program expenses (%) on the vertical axis.

Chapter6: Systems Of Equations And Inequalities
Section: Chapter Questions
Problem 17PS: Cholesterol Cholesterol in human blood is necessary, but too much can lead to health problems. There...

Related questions
Question
100%
Transcribed Image Text:Charity Navigator is America's leading independent charity evaluator. The following data show the total expenses ($), the percentage of the total budget spent on administrative expenses, the
percentage spent on fundraising, and the percentage spent on program expenses for 10 supersized charities (Charity Navigator website). Administrative expenses include overhead, administrative
staff and associated costs, and organizational meetings. Fundraising expenses are what a charity spends to raise money, and program expenses are what the charity spends on the programs and
services it exists to deliver. The sum of the three percentages does not add to 100% because of rounding. Do not round your intermediate calculations.
Total
Administrative Fundraising Program
Expenses
Expenses
Expenses
Expenses
Charity
(millions of $)
(%)
(%)
(%)
1 American Red Cross
3352
3.9
3.9
92.3
2 World Vision
1205
4.1
7.5
88.3
3 Smithsonian Institution
1082
23.4
2.6
73.9
4 Food For The Poor
1048
0.5
2.3
96.9
5 American Cancer Society
1001
5.8
22.3
71.5
6 Volunteers of America
927
8.7
1.7
89.6
7 Dana-Farber Cancer Institute
878
12.9
1.4
85.0
8 AmeriCares
855
0.4
0.8
98.6
9 ALSAC-St. Jude Children's
827
9.4
16.8
73.6
Research Hospital
10 City of Hope
735
13.9
3.1
83.0
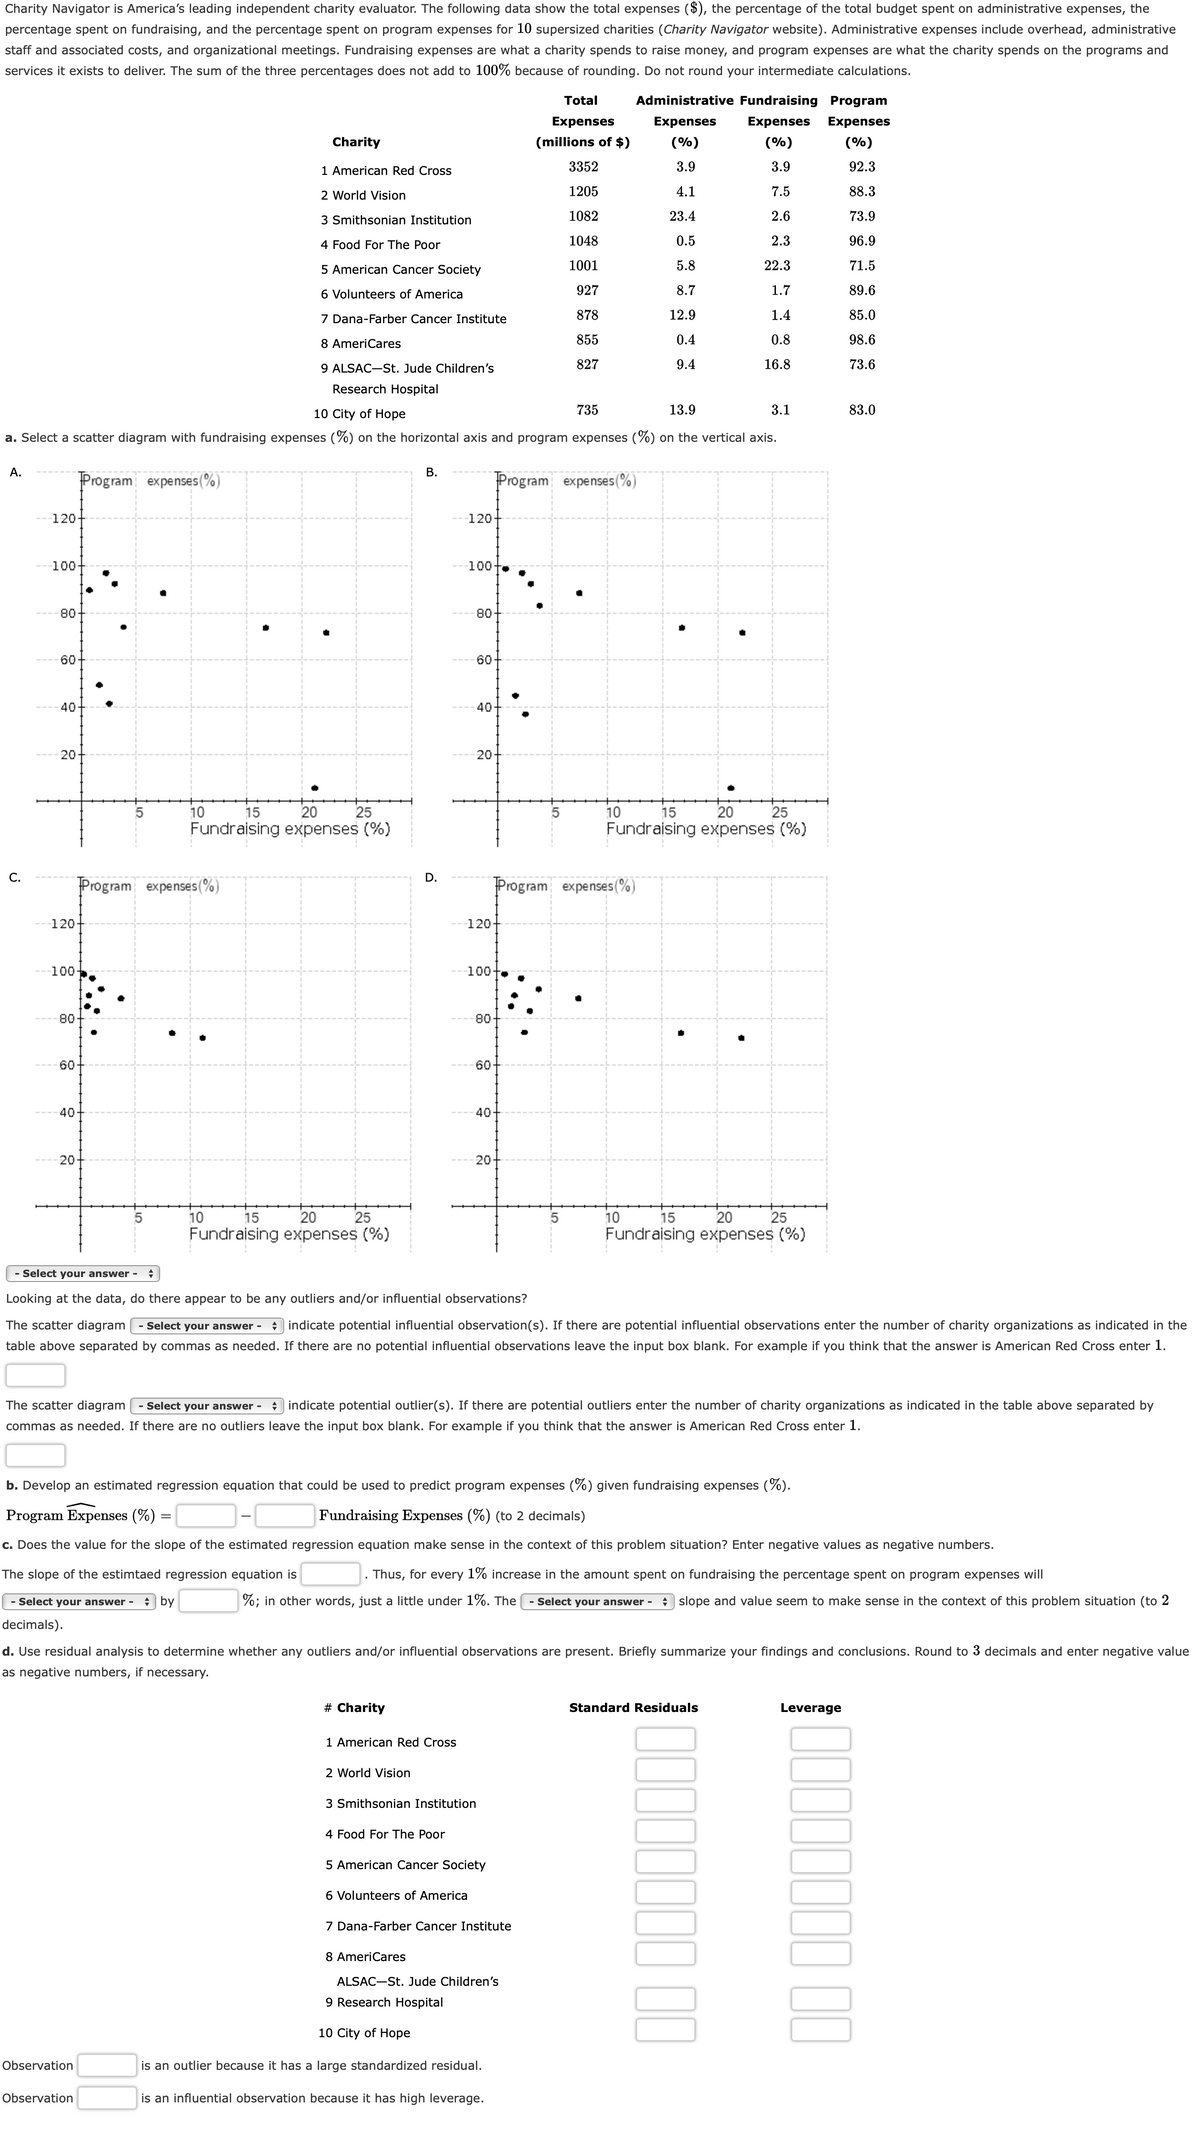
a. Select a scatter diagram with fundraising expenses (%) on the horizontal axis and program expenses (%) on the vertical axis.
A.
В.
Program expenses (%)
Program expenses (%)
120-
120-
100-
100+
80-
80-
60-
60
40
40-
20
20-
25
15
20
Fundraising expenses (%)
25
10
20
Fundraising expenses (%)
10
15
С.
D.
Program expenses(%)
Program expenses(%)
120-
120-
100-
100
80
80-
60
60
40
40-
20
20-
20
15
Fundraising expenses (%)
10
25
15
20
Fundraising expenses (%)
25
5
10
- Select your answer - :
Looking at the data, do there appear to be any outliers and/or influential observations?
The scatter diagram - Select your answer - indicate potential influential observation(s). If there are potential influential observations enter the number of charity organizations as indicated in the
table above separated by commas as needed. If there are no potential influential observations leave the input box blank. For example if you think that the answer is American Red Cross enter 1.
The scatter diagram - Select your answer - : indicate potential outlier(s). If there are potential outliers enter the number of charity organizations as indicated in the table above separated by
commas as needed. If there are no outliers leave the input box blank. For example if you think that the answer is American Red Cross enter 1.
b. Develop an estimated regression equation that could be used to predict program expenses (%) given fundraising expenses (%).
Program Expenses (%) =
Fundraising Expenses (%) (to 2 decimals)
c. Does the value for the slope of the estimated regression equation make sense in the context of this problem situation? Enter negative values as negative numbers.
The slope of the estimtaed regression equation is
. Thus, for every 1% increase in the amount spent on fundraising the percentage spent on program expenses will
|- Select your answer - : by
%; in other words, just a little under 1%. The - Select your answer - slope and value seem to make sense in the context of this problem situation (to 2
decimals).
d. Use residual analysis to determine whether any outliers and/or influential observations are present. Briefly summarize your findings and conclusions. Round to 3 decimals and enter negative value
as negative numbers, if necessary.
# Charity
Standard Residuals
Leverage
1 American Red Cross
2 World Vision
3 Smithsonian Institution
4 Food For The Poor
5 American Cancer Society
6 Volunteers of America
7 Dana-Farber Cancer Institute
8 AmeriCares
ALSAC-St. Jude Children's
9 Research Hospital
10 City of Hope
Observation
is an outlier because
has a large standardized residual.
Observation
is an influential observation because it has high leverage.
Expert Solution
This question has been solved!
Explore an expertly crafted, step-by-step solution for a thorough understanding of key concepts.

This is a popular solution!

Trending now
This is a popular solution!

Step by step
Solved in 5 steps with 1 images

Recommended textbooks for you

Glencoe Algebra 1, Student Edition, 9780079039897…
Algebra
ISBN:
9780079039897
Author:
Carter
Publisher:
McGraw Hill

Glencoe Algebra 1, Student Edition, 9780079039897…
Algebra
ISBN:
9780079039897
Author:
Carter
Publisher:
McGraw Hill