Draw the structure of the compound whose data is shown below, then select all functional groups in the correct structure. Compound 8, C;H;NO2 90 80- 70- 60 50 40 30 20 10 어 4000 600 3500 3000 2500 2000 1800 1600 1400 1200 1000 800 2:H 3 H: 2 H 10 ***The 3.4 ppm signal has only 1 peak.
Draw the structure of the compound whose data is shown below, then select all functional groups in the correct structure. Compound 8, C;H;NO2 90 80- 70- 60 50 40 30 20 10 어 4000 600 3500 3000 2500 2000 1800 1600 1400 1200 1000 800 2:H 3 H: 2 H 10 ***The 3.4 ppm signal has only 1 peak.

Organic Chemistry: A Guided Inquiry
2nd Edition
ISBN:9780618974122
Author:Andrei Straumanis
Publisher:Andrei Straumanis
ChapterL4: Proton (1h) Nmr Spectroscopy
Section: Chapter Questions
Problem 8E

Related questions

Question
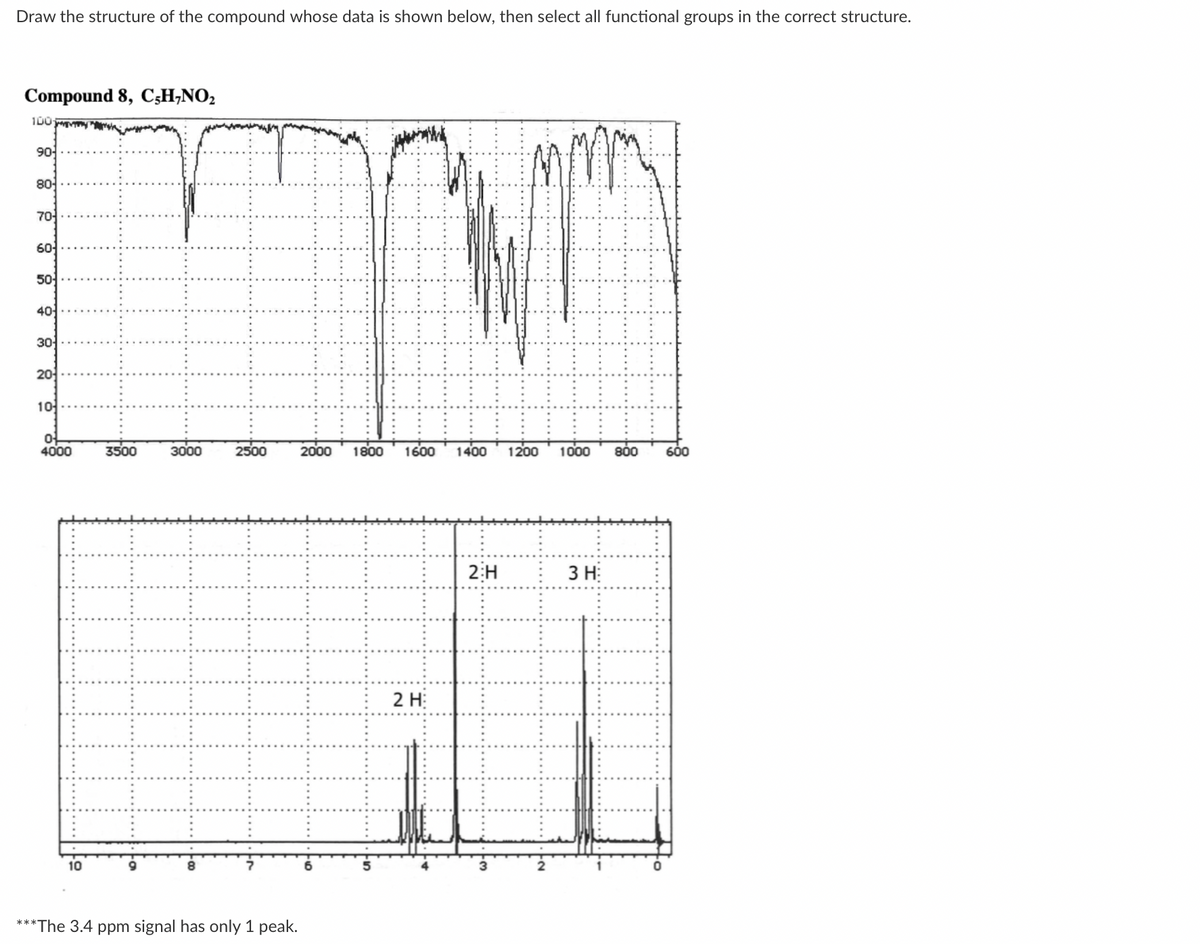
Transcribed Image Text:Draw the structure of the compound whose data is shown below, then select all functional groups in the correct structure.
Compound 8, C;H;NO2
90
80-
70-
60
50
40
30
20
10
어
4000
600
3500
3000
2500
2000
1800
1600
1400
1200
1000
800
2:H
3 H:
2 H
10
***The 3.4 ppm signal has only 1 peak.
Expert Solution
This question has been solved!
Explore an expertly crafted, step-by-step solution for a thorough understanding of key concepts.

This is a popular solution!

Trending now
This is a popular solution!

Step by step
Solved in 2 steps with 2 images

Knowledge Booster


Learn more about
Need a deep-dive on the concept behind this application? Look no further. Learn more about this topic, chemistry and related others by exploring similar questions and additional content below.Recommended textbooks for you
Organic Chemistry: A Guided Inquiry
Chemistry
ISBN:
9780618974122
Author:
Andrei Straumanis
Publisher:
Cengage Learning
Organic Chemistry: A Guided Inquiry
Chemistry
ISBN:
9780618974122
Author:
Andrei Straumanis
Publisher:
Cengage Learning