City City A City B City C City D City E City F City G City H City City J Population (x100,000) Property crimes per 1000 pop. 40 19 16 20 11 19 17 19 29 34 10 32 32 22 10 a) Create a scatter plot of this data. A best fit line will be generated automatically. Adding Points 40+ Scatter Plot 36
City City A City B City C City D City E City F City G City H City City J Population (x100,000) Property crimes per 1000 pop. 40 19 16 20 11 19 17 19 29 34 10 32 32 22 10 a) Create a scatter plot of this data. A best fit line will be generated automatically. Adding Points 40+ Scatter Plot 36

Algebra & Trigonometry with Analytic Geometry
13th Edition
ISBN:9781133382119
Author:Swokowski
Publisher:Swokowski
Chapter3: Functions And Graphs
Section3.3: Lines
Problem 76E

Related questions
Question
100%
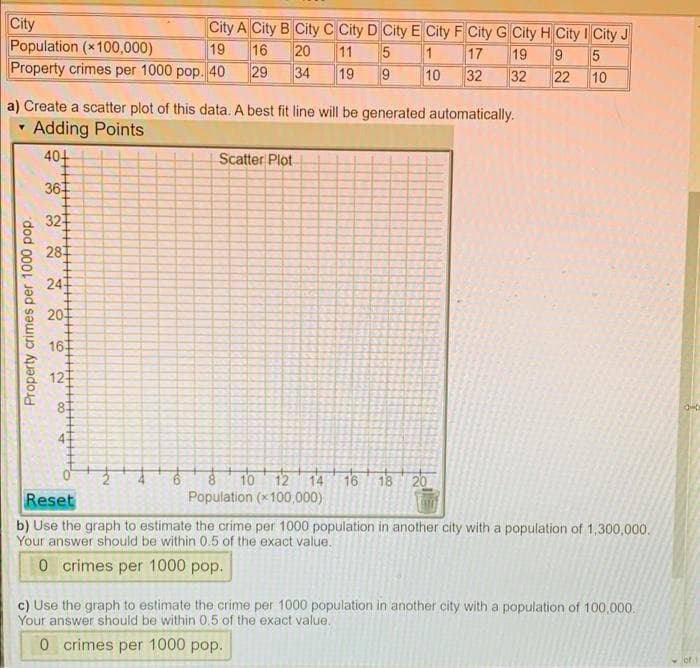
property crime rate statistics were gathered from 10 cities
Transcribed Image Text:City
Population (x100,000)
Property crimes per 1000 pop. 40
City A City B City C City D City E City F City G City H City I City J
19
16
20
11
19
17
10
32
32
19
29
34
22
10
a) Create a scatter plot of this data. A best fit line will be generated automatically.
Adding Points
40+
Scatter Plot
36
32+
28
24
20
16
81
10 12 14 16 18 20
Population (x100,000)
Reset
b) Use the graph to estimate the crime per 1000 population in another city with a population of 1,300,000.
Your answer should be within 0.5 of the exact value.
0 crimes per 1000 pop.
c) Use the graph to estimate the crime per 1000 population in another city with a population of 100,000.
Your answer should be within 0.5 of the exact value.
5 of
0 crimes per 1000 pop.
Property crimes per 1000 pop.
Expert Solution
This question has been solved!
Explore an expertly crafted, step-by-step solution for a thorough understanding of key concepts.

Step by step
Solved in 4 steps with 3 images

Recommended textbooks for you
Algebra & Trigonometry with Analytic Geometry
Algebra
ISBN:
9781133382119
Author:
Swokowski
Publisher:
Cengage


Glencoe Algebra 1, Student Edition, 9780079039897…
Algebra
ISBN:
9780079039897
Author:
Carter
Publisher:
McGraw Hill
Algebra & Trigonometry with Analytic Geometry
Algebra
ISBN:
9781133382119
Author:
Swokowski
Publisher:
Cengage
Glencoe Algebra 1, Student Edition, 9780079039897…
Algebra
ISBN:
9780079039897
Author:
Carter
Publisher:
McGraw Hill

Big Ideas Math A Bridge To Success Algebra 1: Stu…
Algebra
ISBN:
9781680331141
Author:
HOUGHTON MIFFLIN HARCOURT
Publisher:
Houghton Mifflin Harcourt