In a study of the accuracy of fast food drive-through arders, one restaurant had 31 orders that wore not accurate among 376 orders observed. Use a 0.10 significance levei to test the claim that the rate of inaccurate orders is equal to 10%. Does the accuracy rate appear to be acceptable? identify the nul and altemative hypotheses for this test. Choose the correct answer below OA Ho p=0.1 Hp0.1 . Hp 0.1 OC Hpr0.1 OD HD0.1 Hp0.1 denity the tesi statisbe for this hypothesis test. The lest statistc fur typoesis test Round to two deciml places as needed
In a study of the accuracy of fast food drive-through arders, one restaurant had 31 orders that wore not accurate among 376 orders observed. Use a 0.10 significance levei to test the claim that the rate of inaccurate orders is equal to 10%. Does the accuracy rate appear to be acceptable? identify the nul and altemative hypotheses for this test. Choose the correct answer below OA Ho p=0.1 Hp0.1 . Hp 0.1 OC Hpr0.1 OD HD0.1 Hp0.1 denity the tesi statisbe for this hypothesis test. The lest statistc fur typoesis test Round to two deciml places as needed

MATLAB: An Introduction with Applications
6th Edition
ISBN:9781119256830
Author:Amos Gilat
Publisher:Amos Gilat
Chapter1: Starting With Matlab
Section: Chapter Questions
Problem 1P

Related questions
Question
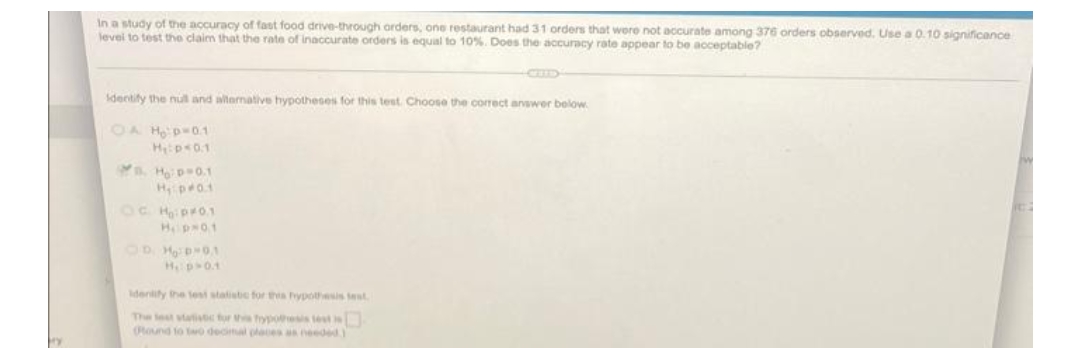
Transcribed Image Text:In a study of the accuracy of fast food drive-through arders, one restaurant had 31 orders that wore not accurate among 376 orders observed. Use a 0.10 significance
levei to test the claim that the rate of inaccurate orders is equal to 10%. Does the accuracy rate appear to be acceptable?
identify the nul and altemative hypotheses for this test. Choose the correct answer below
OA Ho p=0.1
Hps0.1
Ho p 0.1
OC Hipr0.1
Hp 01
OD HD0.1
Hp01
denity the tesi statiste for tha hypothesis test
The lest statistc fur t frypoesis test
(Round to to deciml places as needed)
Expert Solution
This question has been solved!
Explore an expertly crafted, step-by-step solution for a thorough understanding of key concepts.

Step by step
Solved in 2 steps with 2 images

Recommended textbooks for you
MATLAB: An Introduction with Applications
Statistics
ISBN:
9781119256830
Author:
Amos Gilat
Publisher:
John Wiley & Sons Inc

Probability and Statistics for Engineering and th…
Statistics
ISBN:
9781305251809
Author:
Jay L. Devore
Publisher:
Cengage Learning

Statistics for The Behavioral Sciences (MindTap C…
Statistics
ISBN:
9781305504912
Author:
Frederick J Gravetter, Larry B. Wallnau
Publisher:
Cengage Learning
MATLAB: An Introduction with Applications
Statistics
ISBN:
9781119256830
Author:
Amos Gilat
Publisher:
John Wiley & Sons Inc
Probability and Statistics for Engineering and th…
Statistics
ISBN:
9781305251809
Author:
Jay L. Devore
Publisher:
Cengage Learning
Statistics for The Behavioral Sciences (MindTap C…
Statistics
ISBN:
9781305504912
Author:
Frederick J Gravetter, Larry B. Wallnau
Publisher:
Cengage Learning

Elementary Statistics: Picturing the World (7th E…
Statistics
ISBN:
9780134683416
Author:
Ron Larson, Betsy Farber
Publisher:
PEARSON

The Basic Practice of Statistics
Statistics
ISBN:
9781319042578
Author:
David S. Moore, William I. Notz, Michael A. Fligner
Publisher:
W. H. Freeman

Introduction to the Practice of Statistics
Statistics
ISBN:
9781319013387
Author:
David S. Moore, George P. McCabe, Bruce A. Craig
Publisher:
W. H. Freeman