claims that mice ige life span of 32 months will live to be about 40 months old when 40% of the calories in their diet are replaced by vitamins and protein. Is there any reason to believe that <40 if 70 mice that are placed on this diet have an average life of 38 months with a standard deviation of 6.8 months? Use a P-value in your conclusion. Click here to view page 1 of the table of critical values of the t-distribution. Click here to view page 2 of the table of critical values of the t-distribution. Identify the null and alternative hypotheses. OA. Ho: 40 H₁: 40 D. Ho: H=40 H₁:<40 Find the test statistic. -2.46 (Round to two decimal places as needed.) Determine the range into which the P-value falls B. Ho: >40 H₁ =40 O E. Ho: H=40 H₁:40 OC. Ho: <40 H₁ =40 OF. Hoμ=40 H₁:>40
claims that mice ige life span of 32 months will live to be about 40 months old when 40% of the calories in their diet are replaced by vitamins and protein. Is there any reason to believe that <40 if 70 mice that are placed on this diet have an average life of 38 months with a standard deviation of 6.8 months? Use a P-value in your conclusion. Click here to view page 1 of the table of critical values of the t-distribution. Click here to view page 2 of the table of critical values of the t-distribution. Identify the null and alternative hypotheses. OA. Ho: 40 H₁: 40 D. Ho: H=40 H₁:<40 Find the test statistic. -2.46 (Round to two decimal places as needed.) Determine the range into which the P-value falls B. Ho: >40 H₁ =40 O E. Ho: H=40 H₁:40 OC. Ho: <40 H₁ =40 OF. Hoμ=40 H₁:>40

MATLAB: An Introduction with Applications
6th Edition
ISBN:9781119256830
Author:Amos Gilat
Publisher:Amos Gilat
Chapter1: Starting With Matlab
Section: Chapter Questions
Problem 1P

Related questions
Question
100%
I need help with last part please.
Blanks are (Reject or do not reject), (is or is not), and (greater or less)
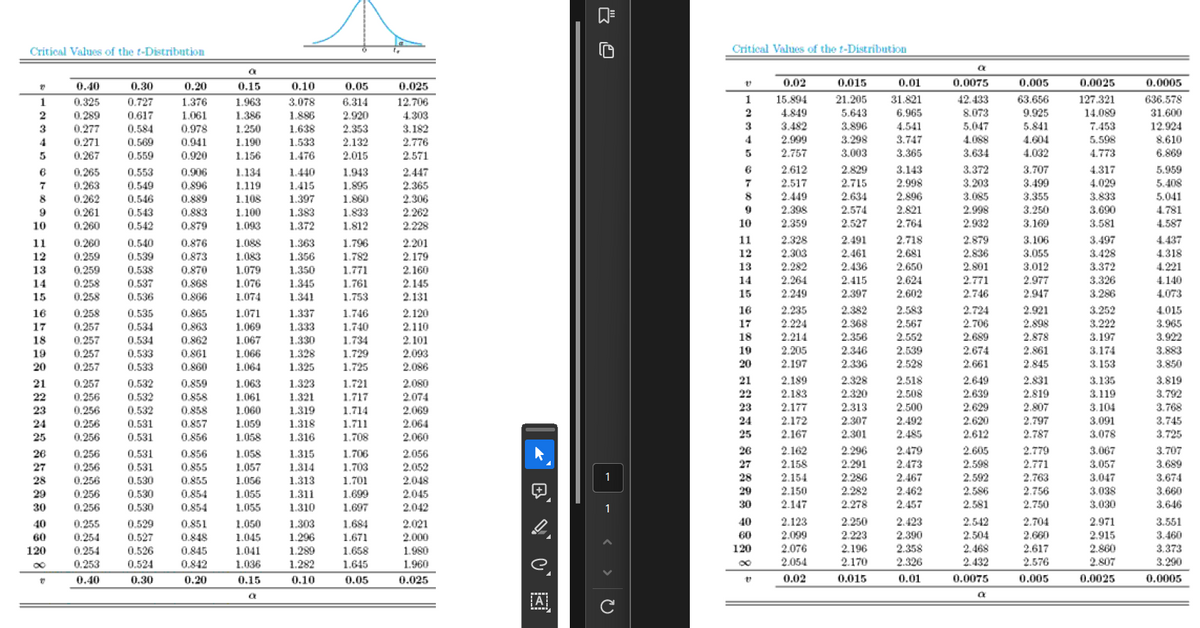
Transcribed Image Text:Critical Values of the t-Distribution
Critical Values of the t-Distribution
a
a
0.40
0.30
0.20
0.15
0.10
0.05
0.025
0.02
0.015
0.01
0.0075
0.005
0.0025
0.0005
1
0.325
0.727
1.376
1.963
3.078
6.314
12.706
1
15.894
21.205
31.821
42.433
63.656
127.321
636.578
2
0.289
0.617
1.061
1.386
1.886
2.920
4.303
2
4.849
5.643
6.965
8.073
9.925
14.089
31.600
3
0.277
0.584
0.978
1.250
1.638
2.353
3.182
3
3.482
3.896
4.541
5.047
5.841
7.453
12.924
4
0.271
0.569
0.941
1.190
1.533
2.132
2.776
4
2.999
3.298
3.747
4.088
4.604
5.598
8.610
5
0.267
0.559
0.920
1.156
1.476
2.015
2.571
5
2.757
3.003
3.365
3.634
4.032
4.773
6.869
в
0.265
0.553
0.906
1.134
1.440
1.943
2.447
6
2.612
2.829
3.143
3.372
3.707
4.317
5.959
7
0.263
0.549
0.896
1.119
1.415
1.895
2.365
7
2.517
2.715
2.998
3.203
3.499
4.029
5.408
8
0.262
0.546
0.889
1.108
1.397
1.860
2.306
8
2.449
2.634
2.896
3.085
3.355
3.833
5.041
9
0.261
0.543
0.883
1.100
1.383
1.833
2.262
9
2.398
2.574
2.821
2.998
3.250
3.690
4.781
10
0.260
0.542
0.879
1.093
1.372
1.812
2.228
10
2.359
2.527
2.764
2.932
3.169
3.581
4.587
11
0.260
0.540
0.876
1.088
1.363
1.796
2.201
11
2.328
2.491
2.718
2.879
3.106
3.497
4.437
12
0.259
0.539
0.873
1.083
1.356
1.782
2.179
12
2.303
2.461
2.681
2.836
3.055
3.428
4.318
13
0.259
0.538
0.870
1.079
1.350
1.771
2.160
13
2.282
2.436
2.650
2.801
3.012
3.372
4.221
14
0.258
0.537
0.868
1.076
1.345
1.761
2.145
14
2.264
2.415
2.624
2.771
2.977
3.326
4.140
15
0.258
0.536
0.866
1.074
1.341
1.753
2.131
15
2.249
2.397
2.602
2.746
2.947
3.286
4.073
16
0.258
0.535
0.865
1.071
1.337
1.746
2.120
16
2.235
2.382
2.583
2.724
2.921
3.252
4.015
17
0.257
0.534
0.863
1.069
1.333
1.740
2.110
17
2.224
2.368
2.567
2.706
2.898
3.222
3.965
18
0.257
0.534
0.862
1.067
1.330
1.734
2.101
18
2.214
2.356
2.552
2.689
2.878
3.197
3.922
19
0.257
0.533
0.861
1.066
1.328
1.729
2.093
2.205
2.346
2.539
2.674
2.861
3.174
3.883
20
0.257
0.533
0.860
1.064
1.325
1.725
2.086
20
2.197
2.336
2.528
2.661
2.845
3.153
3.850
21
0.257
0.532
0.859
1.063
1.323
1.721
2.080
21
2.189
2.328
2.518
2.649
2.831
3.135
3.819
22
0.256
0.532
0.858
1.061
1.321
1.717
2.074
22
2.183
2.320
2.508
2.639
2.819
3.119
3.792
23
0.256
0.532
0.858
1.060
1.319
1.714
2.069
23
2.177
2.313
2.500
2.629
2.807
3.104
3.768
24
0.256
0.531
0.857
1.059
1.318
1.711
2.064
24
2.172
2.307
2.492
2.620
2.797
3.091
3.745
25
0.256
0.531
0.856
1.058
1.316
1.708
2.060
25
2.167
2.301
2.485
2.612
2.787
3.078
3.725
26
0.256
0.531
0.856
1.058
1.315
1.706
2.056
27
0.256
0.531
0.855
1.057
1.314
1.703
2.052
28
0.256
0.530
0.855
1.056
1.313
1.701
2.048
-
29
0.256
0.530
0.854
1.055
1.311
1.699
2.045
30
0.256
0.530
0.854
1.055
1.310
1.697
2.042
40
0.255
0.529
0.851
1.050
1.303
1.684
2.021
60
0.254
0.527
0.848
1.045
1.296
1.671
2.000
120
0.254
0.526
0.845
1.041
1.289
1.658
1.980
8"
0.253
0.524
0.842
1.036
1.282
1.645
1.960
e
0.40
0.30
0.20
0.15
0.10
- <>
120
888 988
26
2.162
2.296
2.479
2.605
2.779
3.067
3.707
27
2.158
2.291
2.473
2.598
2.771
3.057
3.689
28
2.154
2.286
2.467
2.592
2.763
3.047
3.674
2.150
2.282
2.462
2.586
2.756
3.038
3.660
30
2.147
2.278
2.457
2.581
2.750
3.030
3.646
40
2.123
2.250
2.423
2.542
2.704
2.971
3.551
60
2.099
2.223
2.390
2.504
2.660
2.915
3.460
2.076
2.196
2.358
2.468
2.617
2.860
3.373
2.054
2.170
2.326
2.432
2.576
2.807
3.290
0.05
0.025
0.02
0.015
0.01
0.0075
0.005
0.0025
0.0005
a
A
a
C
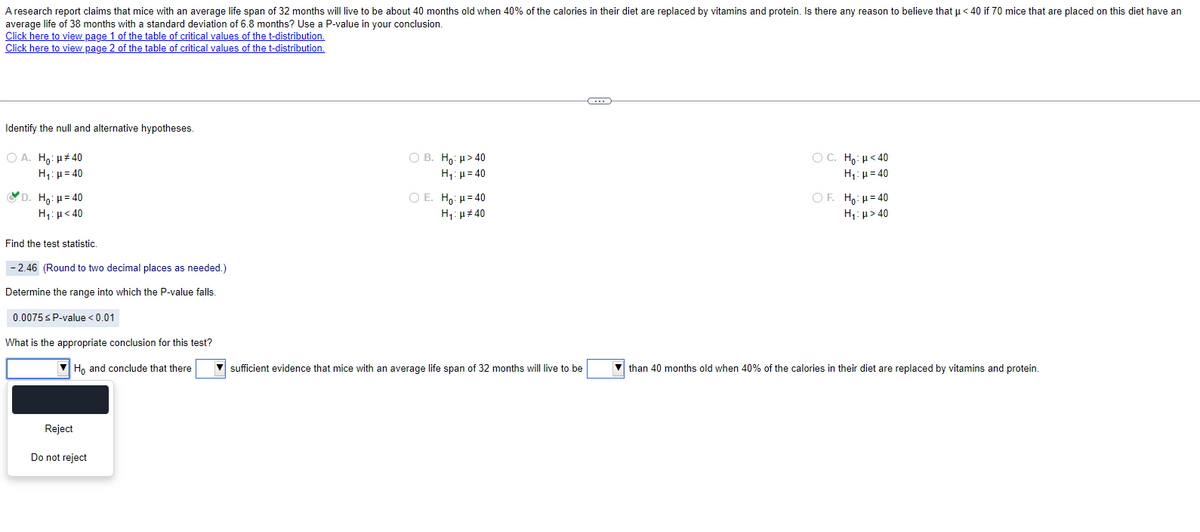
Transcribed Image Text:A research report claims that mice with an average life span of 32 months will live to be about 40 months old when 40% of the calories in their diet are replaced by vitamins and protein. Is there any reason to believe that μ<40 if 70 mice that are placed on this diet have an
average life of 38 months with a standard deviation of 6.8 months? Use a P-value in your conclusion.
Click here to view page 1 of the table of critical values of the t-distribution.
Click here to view page 2 of the table of critical values of the t-distribution.
Identify the null and alternative hypotheses.
○ A. Ho: #40
H₁ =40
D. Ho: H=40
H₁: <40
Find the test statistic.
-2.46 (Round to two decimal places as needed.)
Determine the range into which the P-value falls.
0.0075 ≤ P-value <0.01
What is the appropriate conclusion for this test?
Ho and conclude that there
Reject
Do not reject
B. Ho: μ>40
H₁:μ=40
O E. Ho: H=40
H₁: #40
ỌC. Ho: "<40
H₁ =40
OF. Ho: μ=40
H₁: >40
sufficient evidence that mice with an average life span of 32 months will live to be
than 40 months old when 40% of the calories in their diet are replaced by vitamins and protein.
Expert Solution
This question has been solved!
Explore an expertly crafted, step-by-step solution for a thorough understanding of key concepts.

Step by step
Solved in 3 steps

Recommended textbooks for you
MATLAB: An Introduction with Applications
Statistics
ISBN:
9781119256830
Author:
Amos Gilat
Publisher:
John Wiley & Sons Inc

Probability and Statistics for Engineering and th…
Statistics
ISBN:
9781305251809
Author:
Jay L. Devore
Publisher:
Cengage Learning

Statistics for The Behavioral Sciences (MindTap C…
Statistics
ISBN:
9781305504912
Author:
Frederick J Gravetter, Larry B. Wallnau
Publisher:
Cengage Learning
MATLAB: An Introduction with Applications
Statistics
ISBN:
9781119256830
Author:
Amos Gilat
Publisher:
John Wiley & Sons Inc
Probability and Statistics for Engineering and th…
Statistics
ISBN:
9781305251809
Author:
Jay L. Devore
Publisher:
Cengage Learning
Statistics for The Behavioral Sciences (MindTap C…
Statistics
ISBN:
9781305504912
Author:
Frederick J Gravetter, Larry B. Wallnau
Publisher:
Cengage Learning

Elementary Statistics: Picturing the World (7th E…
Statistics
ISBN:
9780134683416
Author:
Ron Larson, Betsy Farber
Publisher:
PEARSON

The Basic Practice of Statistics
Statistics
ISBN:
9781319042578
Author:
David S. Moore, William I. Notz, Michael A. Fligner
Publisher:
W. H. Freeman

Introduction to the Practice of Statistics
Statistics
ISBN:
9781319013387
Author:
David S. Moore, George P. McCabe, Bruce A. Craig
Publisher:
W. H. Freeman