Class (L) 100 < 150 150 < 200 200-250 250 < 300 300-350 350<400 Total Frequency, f Midpoint, m 40 W 130 X 75 35 Σf 125 175 225 275 325 375 fm 5 000 17 850 29 250 Y 24 375 13 125 Σfm fm² 625 000 3 123 750 6 581 250 Z 7 921 875 4 921 875 Σfm² Cumulative frequency 40 ? 272 ? 465 500
Class (L) 100 < 150 150 < 200 200-250 250 < 300 300-350 350<400 Total Frequency, f Midpoint, m 40 W 130 X 75 35 Σf 125 175 225 275 325 375 fm 5 000 17 850 29 250 Y 24 375 13 125 Σfm fm² 625 000 3 123 750 6 581 250 Z 7 921 875 4 921 875 Σfm² Cumulative frequency 40 ? 272 ? 465 500

Glencoe Algebra 1, Student Edition, 9780079039897, 0079039898, 2018
18th Edition
ISBN:9780079039897
Author:Carter
Publisher:Carter
Chapter10: Statistics
Section10.5: Comparing Sets Of Data
Problem 14PPS

Related questions
Question
Using the sample data in Table 1 above, determine the
A 244.1l
B 262.9l
C 240.9l
D 252.3l
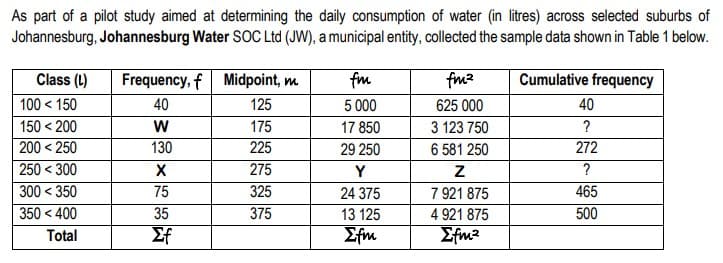
Transcribed Image Text:As part of a pilot study aimed at determining the daily consumption of water (in litres) across selected suburbs of
Johannesburg, Johannesburg Water SOC Ltd (JW), a municipal entity, collected the sample data shown in Table 1 below.
Cumulative frequency
Class (L)
100 < 150
150 < 200
200 < 250
250 < 300
300 < 350
350 < 400
Total
Frequency, f Midpoint, m
40
125
W
175
130
225
275
325
375
X
75
35
Σf
fm
5 000
17 850
29 250
Y
24 375
13 125
Σfm
fm²
625 000
3 123 750
6 581 250
Z
7 921 875
4 921 875
Σfm²
40
?
272
?
465
500
Expert Solution
This question has been solved!
Explore an expertly crafted, step-by-step solution for a thorough understanding of key concepts.

Step by step
Solved in 3 steps

Recommended textbooks for you
Glencoe Algebra 1, Student Edition, 9780079039897…
Algebra
ISBN:
9780079039897
Author:
Carter
Publisher:
McGraw Hill
Glencoe Algebra 1, Student Edition, 9780079039897…
Algebra
ISBN:
9780079039897
Author:
Carter
Publisher:
McGraw Hill