classes lead to better student outcomes. You have c ou have collected data on 22 students at SDSU. You ge class size for the student. regression: Size + i s:
Q: Suppose that in a random selection of 100 colored candies, 30% of them are blue. The candy company…
A: Sample size(n)=100Sample proportion()=0.30Population proportion(P)=0.20and
Q: When we are computing a simple linear regression line, there are certain conditions that must b met…
A: the outlier condition is met in simple linear regression is as below step 2
Q: When purchasing bulk orders of batteries, a toy manufacturer uses this acceptance sampling plan:…
A: Given:Sample size n = 46The entire shipment is accepted if at most 3 batteries do not meet…
Q: Is there a statistically significant difference between classical and dance groups in this data set?…
A: From the test statistics table, we have the z-score equal to -1.811 and the corresponding p-value is…
Q: In Learning Activity 4.1, we said that a game is called fair when the expected value is 0. How much…
A: Given the experiment of drawing two marbles without replacement from a bag, which contains two red…
Q: Answer the following questions about the relationships between pairs of variables and the values of…
A: If the scatterplot shows an increasing pattern, then it indicates that the relationship between two…
Q: The two-way relative frequency table shows the results from the lunch orders from an upperclassman…
A: 11th Grade12th GradeTotalSalad12%6%18%Sandwich20%24%44%Soup8%30%38%Total40%60%100%
Q: A plant distills liquid air to produce oxygen and nitrogen. The purity of the oxygen (expressed as a…
A: The least square regression equation is as follows:
Q: An existing inventory for a test measuring self-esteem indicates that the scores have a standard…
A: Given, Population standard deviation, σ = 10 Sample size, n = 80Sample mean, = 59Confidence level,…
Q: Each of two parents has the genotype red/brown, which consists of the pair of alleles that determine…
A: The information provided in the question are as follows:-Each of two parents has the genotype red or…
Q: Suppose that we have postulated the model Y₁ = Bo + εi fori = 1, ..., n, where the &; are…
A: Given model is: Y =
Q: Let X1,X2, . . . , Xn be a random sample from the distribution N(θ1, θ2). Show that the likelihood…
A: Random variables follows normal distribution with .Hypotheses are given as,where is unspecified.The…
Q: 2) A study to compare four groups took random samples from each population of interest of sizes 38,…
A: There is a study to compare the 4 groups. Samples taken from populations respectively{ 38,42,31,45 }…
Q: Given the following hypotheses: Họ: Hs10 H₁: μ> 10 A random sample of 10 observations is selected…
A: The null and alternative hypothesis isH0:H1:sample size(n)=10Mean()=11standard…
Q: A sleep researcher is interested in learning about how to help people fall asleep faster at night…
A: Let X: the amount of time taken by people to fall asleep.There are 2 different groups:X1: Regular…
Q: You would like to construct a 95% confidence interval to estimate the population mean PCB…
A: Sample mean = 628Standard deviation = 50
Q: The table provided below shows paired data for the heights of a certain country's presidents and…
A: The data table for the election heights:President's height (cm)Opponent's height…
Q: (a) Consider a t distribution with 22 degrees of freedom. Compute P(-1.89<t<1.89). Round your answer…
A: a)given t-distribution has degree of freedom =22By using excel we can calculate the p-value ( we use…
Q: 14. Among patients who were improving on a certain day (in the critical care unit of a certain…
A: Given that for patients who were improving on a certain day (in the critical care unit of a certain…
Q: Estimate the number of pistons in the sample that are defective by giving the mean of the relevant…
A: It is given that the number of observations is independent of the probability of success p = 3% =…
Q: (a) Consider at distribution with 9 degrees of freedom. Compute P (t ≤ 1.22). Round your answer to…
A: To compute P(t≤1.22) for a t-distribution with 9 degrees of freedom, you can use a t-distribution…
Q: Using your favorite statistics software package, you generate a scatter plot with a regression…
A: r=-0.13 y^=−74.27x+98.53Note: According to the Bartleby guidelines expert solve only one question…
Q: find the standard deviation of the population.
A: It is given as the ages (in years) of the 6 doctors at a local clinic are:41, 43, 33, 32, 31, 48
Q: Groups: 1 = 5-25 years, 2 = 26-59 years, 3 = 60-92 years Which of the following statements is true…
A: The sample difference between group-2 and group-1's FIQ is 1.257 with a corresponding p-value of…
Q: In a recent study, 50 males used a new weight-loss supplement, and 39 of them experienced weight…
A: It is given that, 50 males used the new weight-loss supplement and 39 of them experienced weight…
Q: Consider the pair of interaction plots showing mass data for Arabidopsis plants grown at 4…
A: Let a random variable be such that . Then the mean of the variable is given by .On observing the…
Q: In a survey of 2524 adults in a recent year, 1392 say they have made a New Year's resolution.…
A: Given,n = 2524X = 1392Using formula , ( confidence interval)C =
Q: The following two samples were collected as matched pairs: Pair 1 2 3 4 sample 1 sample 2 8 6.3 9.8…
A: Used paired distribution of difference of mean to calculate the test statistic
Q: Each year, taxpayers are able to contribute money to various charities via their IRS tax forms. The…
A: The data shows the amounts of money donated via IRS tax forms by 7 taxpayers.
Q: Thirty-nine different video games showing violence were observed. The duration times of violence (in…
A: Given statement is "39 different video games showing violence were observed. The duration times of…
Q: What is the p-value rounded to 3 decimal places?
A: According to the given information in this question, we need to rest two parts
Q: At distribution with 8 degrees of freedom is graphed below. The region under the curve to the right…
A: A distribution with degrees of freedom is graphed below.The area under the curve to the right of…
Q: There is a popular lottery in which a ticket is called a scratcher. You are an auditor and want to…
A: Given that, the confidence level is 90%.
Q: A psychology graduate student wants to test the claim that there is a significant difference between…
A: There are two dependent samples which are Spouse 1 and Spouse 2.We have to test whether there is a…
Q: The Chartered Financial Analyst (CFA) designation is fast becoming a requirement for serious…
A: sample size(n)=30Mean()=83277standard deviation(s)=5473Confidence level=90%
Q: freedom. Compute P (-1.23 < t <1.23). Round your answer to at least three decimal places.…
A: It is given as the statement about the t-distribution.
Q: In a test of the hypotheses Ho : p=0.23 versus Ha: p=0.23 using a sample size of 48, a test…
A: Since alternative hypothesis is two-sided (Ha: p ≠ 0.23), you need to find the probability of…
Q: To determine if his teaching method increases students' learning, a professor administers a pretest…
A: Test ScoresPretestPosttest9599537653669090576465646282586661597869
Q: PART C (c)Does the 99% confidence interval you constructed contradict the manufacturer's claim?…
A: Sample size,,,n=24,,Sample size, n=24,Sample standard deviation, s=0.44level of significance, =…
Q: An advertising firm wishes to demonstrate to its clients the effectiveness of the advertising c…
A: The given regression line for estimating the "percentage increase in sales" (dependent variable, y)…
Q: So, we choose a random sample of strawberries. The sample has a mean of 16 days and a standard de…
A:
Q: In a study to investigate the effects of xylitol with respect to ear infections, 346 children were…
A: The question is about two sample proportion test.Given :Total no. of randomly selected children =…
Q: Thanks to an initiative to recruit top students, an administrator at a college claims that this…
A: According to the given information in this question, there are more than three subparts according to…
Q: Which of the following best describes the conditions that would result in a one-factor ANOVA…
A: In one way ANOVA, the larger the F-statistic value, the smaller the p-value. The F-statistic is…
Q: An electronics manufacturing process has historically had a mean completion time of 75 minutes. It…
A: Mean()=71standard deviation(s)=9sample size(n)=16significance level()=0.10
Q: Let z be a random variable with a standard normal distribution. Find the indicated probability.…
A: P(−1.75 ≤ z ≤ −1.27)
Q: Let X X -2x X be a random sample from exponential distribution with pdf f(x) = λe n 1' 2' Which is…
A:
Q: In a recent poll, 70% of Frisco residents are in favor of a new mayor. Round your answers to three…
A: Number of samples (n) = 9propobabilty of success (p) = 0.7Let "X" be the people who are in favor of…
Q: Use automatic linear regression (e.g. using Excel or Sheets) to find a line of best fit, with the…
A: From the given information,X=YearsY=Height…
Q: A scatterplot of student height, in inches, versus corresponding arm span length, in inches, is…
A: A scatterplot is a graphical representation that depicts the relationship between two quantitative…
Respond to the question with a concise and accurate answer, along with a clear explanation and step-by-step solution, or risk receiving a downvote.
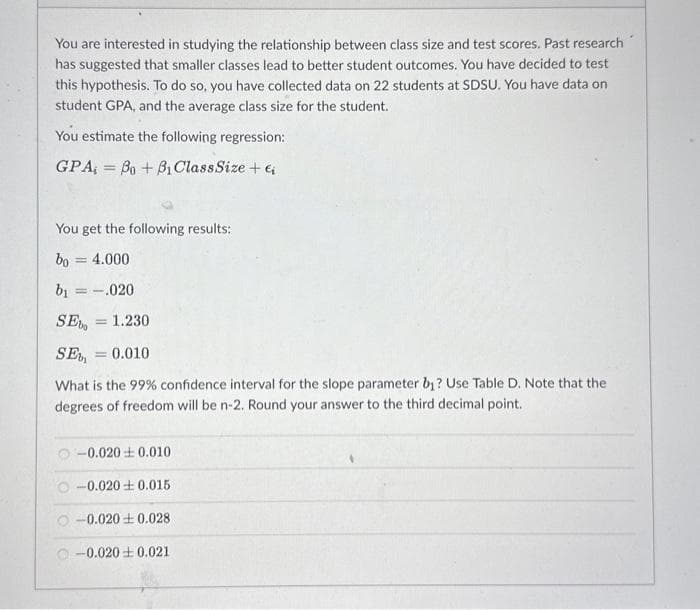
Step by step
Solved in 3 steps
- Olympic Pole Vault The graph in Figure 7 indicates that in recent years the winning Olympic men’s pole vault height has fallen below the value predicted by the regression line in Example 2. This might have occurred because when the pole vault was a new event there was much room for improvement in vaulters’ performances, whereas now even the best training can produce only incremental advances. Let’s see whether concentrating on more recent results gives a better predictor of future records. (a) Use the data in Table 2 (page 176) to complete the table of winning pole vault heights shown in the margin. (Note that we are using x=0 to correspond to the year 1972, where this restricted data set begins.) (b) Find the regression line for the data in part ‚(a). (c) Plot the data and the regression line on the same axes. Does the regression line seem to provide a good model for the data? (d) What does the regression line predict as the winning pole vault height for the 2012 Olympics? Compare this predicted value to the actual 2012 winning height of 5.97 m, as described on page 177. Has this new regression line provided a better prediction than the line in Example 2?The Mayor of texas whom is partners with a local agriculturalist wants to know how the amount of fertilizer and the amount of water given to plants affect their growth. The results were inputted into MINITAB so as to fit the model a) Write out the regression equation b) What is the sample size used in this investigation? c) Determine the values of *, ** and ***, **** d) Conduct a hypothesis test, at the 5% level of significance, to determine whether ? is significant. e) What would be the growth of the plant if 4g of fertilizer and 7g of ater was given to it daily? f) Carry out an F -test at the 1% significance level to determine whether the model is significantWhy was the variable “# of customer service representatives” dropped from the model? Write the regression equation. Sales of men’s clothing (predicted) = Are the regression coefficients significantly different from 0? If one mails 10,000 catalogs and has 15 phone lines open, what would the predicted sales of men’s clothing be? How would you interpret the regression coefficient for number of catalogs mailed? What is the final R2 of the model? How would you interpret this? Which of the two independent variables is the most important predictor of the dependent variable? Why?
- Suppose that R2= 1 for a data set. What can you say abota. SSE? b. SSR? c. the utility of the sample multiple linear regression equation for making predictions?BASED ON THIS DATA, what does the r^2 values tell you? and the linear regression line is the information statistically significant?It is considered that the number of employees in the enterprise affects the number of production. Data are given below. Which of the following is the simple linear regression equation?
- Given the partial results from a linear regression model below, a sample size of 504, and ɑ=0.05, What is the F-Statistic for the overall model? Is it statistically significant? What is the R2 for the regression model above?When you are deciding which variables to include as predictors in a multiple regression equation, what are some conditions that you must consider first?What is the significance of R and R2 and of a regression model?
- Which of the multivariate regression parameters listed below would be best interpreted as: the proportion of variation in the dependent variable explain by all the independent variables in the model. a b1 X1 R2Given a generic data set (x,y) with a linear regression. How do you determine if the y(dependent) will be less than a certain value?What is the effect of this violation on the regression model? "The number of observations n is less than or equal to the number of parameters to be estimated"