PART C (c)Does the 99% confidence interval you constructed contradict the manufacturer's claim? Choose the best answer from the choices below. ___ No, the confidence interval does not contradict the claim. The claimed standard deviation 0.59 is inside the 99% confidence interval. ___ No, the confidence interval does not contradict the claim. The claimed standard deviation 0.59 is outside the 99% confidence interval. ___ Yes, the confidence interval contradicts the claim. The claimed standard deviation 0.59 is inside the 99% confidence interval. ___ Yes, the confidence interval contradicts the claim. The claimed standard deviation 0.59 is outside the 99% confidence interval.
PART C (c)Does the 99% confidence interval you constructed contradict the manufacturer's claim? Choose the best answer from the choices below. ___ No, the confidence interval does not contradict the claim. The claimed standard deviation 0.59 is inside the 99% confidence interval. ___ No, the confidence interval does not contradict the claim. The claimed standard deviation 0.59 is outside the 99% confidence interval. ___ Yes, the confidence interval contradicts the claim. The claimed standard deviation 0.59 is inside the 99% confidence interval. ___ Yes, the confidence interval contradicts the claim. The claimed standard deviation 0.59 is outside the 99% confidence interval.

MATLAB: An Introduction with Applications
6th Edition
ISBN:9781119256830
Author:Amos Gilat
Publisher:Amos Gilat
Chapter1: Starting With Matlab
Section: Chapter Questions
Problem 1P

Related questions
Question
PART C
(c)Does the 99% confidence interval you constructed contradict the manufacturer's claim?
Choose the best answer from the choices below.
Choose the best answer from the choices below.
|
99% confidence interval.
99% confidence interval.
99% confidence interval.
|
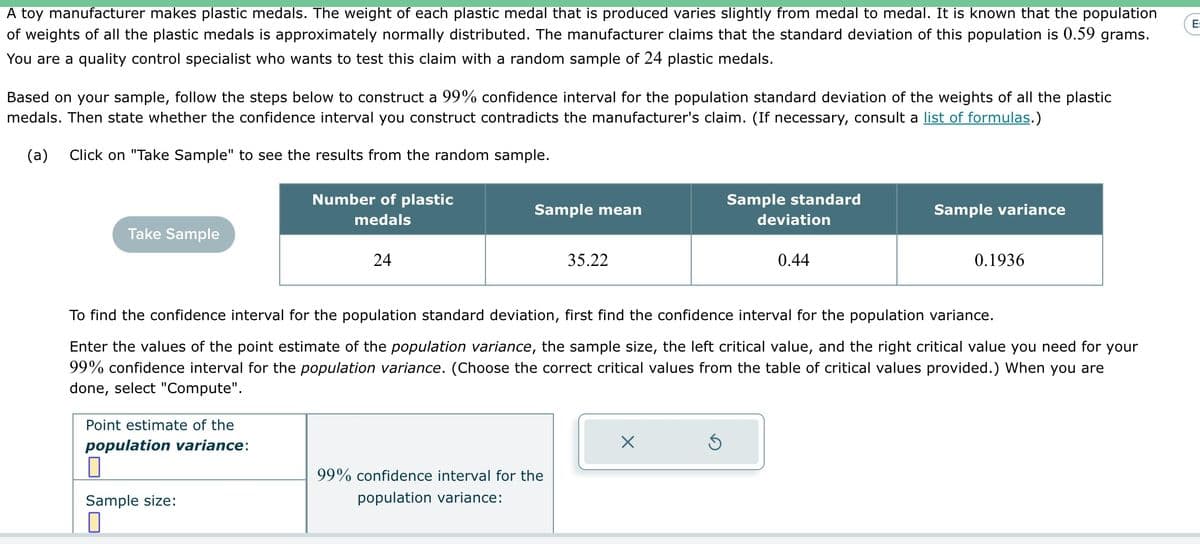
Transcribed Image Text:A toy manufacturer makes plastic medals. The weight of each plastic medal that is produced varies slightly from medal to medal. It is known that the population
of weights of all the plastic medals is approximately normally distributed. The manufacturer claims that the standard deviation of this population is 0.59 grams.
You are a quality control specialist who wants to test this claim with a random sample of 24 plastic medals.
Based on your sample, follow the steps below to construct a 99% confidence interval for the population standard deviation of the weights of all the plastic
medals. Then state whether the confidence interval you construct contradicts the manufacturer's claim. (If necessary, consult a list of formulas.)
(a) Click on "Take Sample" to see the results from the random sample.
Take Sample
Number of plastic
medals
Point estimate of the
population variance:
0
Sample size:
24
Sample mean
35.22
99% confidence interval for the
population variance:
X
Sample standard
S
deviation
To find the confidence interval for the population standard deviation, first find the confidence interval for the population variance.
Enter the values of the point estimate of the population variance, the sample size, the left critical value, and the right critical value you need for your
99% confidence interval for the population variance. (Choose the correct critical values from the table of critical values provided.) When you are
done, select "Compute".
0.44
Sample variance
0.1936
E
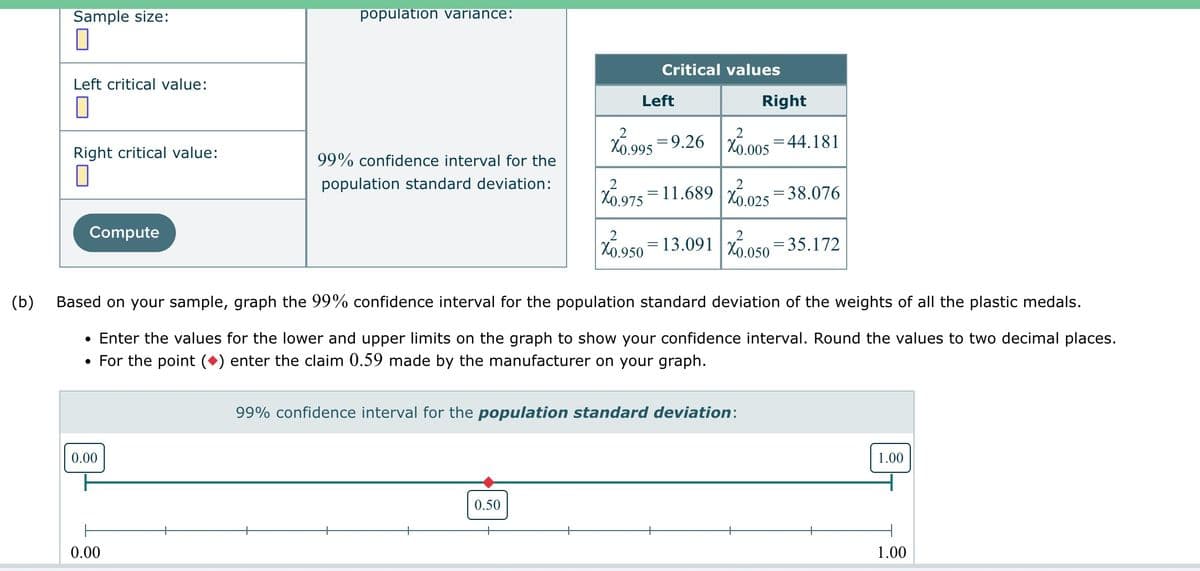
Transcribed Image Text:(b)
Sample size:
0
Left critical value:
П
Right critical value:
0
Compute
●
0.00
population variance:
0.00
99% confidence interval for the
population standard deviation:
Right
2
X0.995 =9.26 0.005=44.181
0.50
Critical values
Left
=
2
0.975 11.689 0.025
2
=
Based on your sample, graph the 99% confidence interval for the population standard deviation of the weights of all the plastic medals.
Enter the values for the lower and upper limits on the graph to show your confidence interval. Round the values to two decimal places.
For the point (◆) enter the claim 0.59 made by the manufacturer on your graph.
2
2
X0.950 13.091 X0.050=35.172
= 38.076
99% confidence interval for the population standard deviation:
1.00
1.00
Expert Solution
This question has been solved!
Explore an expertly crafted, step-by-step solution for a thorough understanding of key concepts.

This is a popular solution!

Trending now
This is a popular solution!

Step by step
Solved in 3 steps with 12 images

Recommended textbooks for you
MATLAB: An Introduction with Applications
Statistics
ISBN:
9781119256830
Author:
Amos Gilat
Publisher:
John Wiley & Sons Inc

Probability and Statistics for Engineering and th…
Statistics
ISBN:
9781305251809
Author:
Jay L. Devore
Publisher:
Cengage Learning

Statistics for The Behavioral Sciences (MindTap C…
Statistics
ISBN:
9781305504912
Author:
Frederick J Gravetter, Larry B. Wallnau
Publisher:
Cengage Learning
MATLAB: An Introduction with Applications
Statistics
ISBN:
9781119256830
Author:
Amos Gilat
Publisher:
John Wiley & Sons Inc
Probability and Statistics for Engineering and th…
Statistics
ISBN:
9781305251809
Author:
Jay L. Devore
Publisher:
Cengage Learning
Statistics for The Behavioral Sciences (MindTap C…
Statistics
ISBN:
9781305504912
Author:
Frederick J Gravetter, Larry B. Wallnau
Publisher:
Cengage Learning

Elementary Statistics: Picturing the World (7th E…
Statistics
ISBN:
9780134683416
Author:
Ron Larson, Betsy Farber
Publisher:
PEARSON

The Basic Practice of Statistics
Statistics
ISBN:
9781319042578
Author:
David S. Moore, William I. Notz, Michael A. Fligner
Publisher:
W. H. Freeman

Introduction to the Practice of Statistics
Statistics
ISBN:
9781319013387
Author:
David S. Moore, George P. McCabe, Bruce A. Craig
Publisher:
W. H. Freeman