Click the icon to view the data for home voltages and generator voltages et ji, be the population mean home voltage and let ji, be the population mean generator voltage. What are the null and alternative hypotheses? OB. H DA H H₁ H₂ C. H₂ Calculate the test statistic (Round to three dicimal places as needed.) CITO mean. The difference ind the P-value value (Round to four decimal places as needed) Make a conclusion about the nut hypothesis and a final conclusion that addresses the original claim H₂ There H₁P₁P₂ OD. 1 H₂ PP sufficient evidence to warrant rejection of the claim that the sample of home voltages and the sample of generator voltages are from populations with the same statistically significant
Click the icon to view the data for home voltages and generator voltages et ji, be the population mean home voltage and let ji, be the population mean generator voltage. What are the null and alternative hypotheses? OB. H DA H H₁ H₂ C. H₂ Calculate the test statistic (Round to three dicimal places as needed.) CITO mean. The difference ind the P-value value (Round to four decimal places as needed) Make a conclusion about the nut hypothesis and a final conclusion that addresses the original claim H₂ There H₁P₁P₂ OD. 1 H₂ PP sufficient evidence to warrant rejection of the claim that the sample of home voltages and the sample of generator voltages are from populations with the same statistically significant

Glencoe Algebra 1, Student Edition, 9780079039897, 0079039898, 2018
18th Edition
ISBN:9780079039897
Author:Carter
Publisher:Carter
Chapter10: Statistics
Section10.3: Measures Of Spread
Problem 26PFA

Related questions
Question
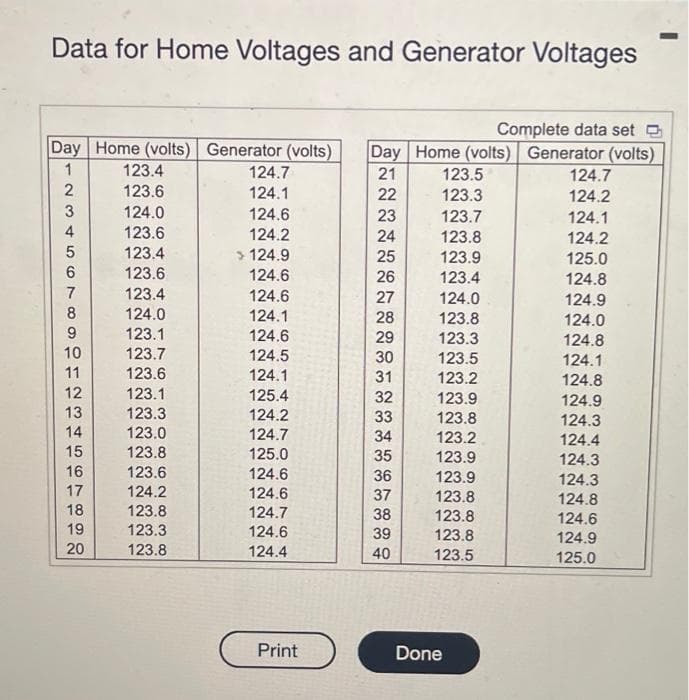
Transcribed Image Text:Data for Home Voltages and Generator Voltages
Complete data set
Day Home (volts) Generator (volts) Day Home (volts) Generator (volts)
1
21
2
22
23
24
25
26
234
3
5
6
7
8
9
10
11
12
13
14
15
16
17
18
19
20
123.4
123.6
124.0
123.6
123.4
123.6
123.4
124.0
123.1
123.7
123.6
123.1
123.3
123.0
123.8
123.6
124.2
123.8
123.3
123.8
124.7
124.1
124.6
124.2
> 124.9
124.6
124.6
124.1
124.6
124.5
124.1
125.4
124.2
124.7
125.0
124.6
124.6
124.7
124.6
124.4
Print
27
28
29
30
31
32
33
34
35
36
37
38
39
40
123.5
123.3
123.7
123.8
123.9
123.4
124.0
123.8
123.3
123.5
123.2
123.9
123.8
123.2
123.9
123.9
123.8
123.8
123.8
123.5
Done
124.7
124.2
124.1
124.2
125.0
124.8
124.9
124.0
124.8
124.1
124.8
124.9
124.3
124.4
124.3
124.3
124.8
124.6
124.9
125.0
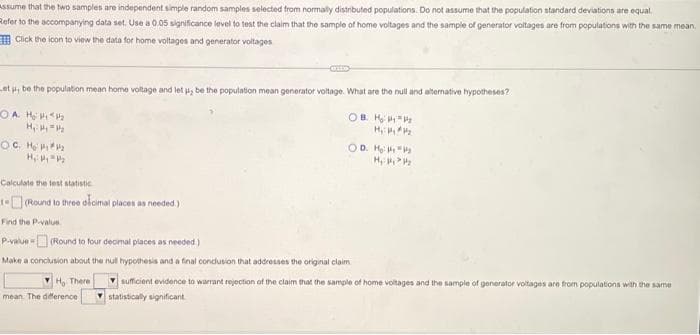
Transcribed Image Text:Assume that the two samples are independent simple random samples selected from normally distributed populations. Do not assume that the population standard deviations are equal.
Refer to the accompanying data set. Use a 0.05 significance level to test the claim that the sample of home voltages and the sample of generator voltages are from populations with the same mean
Click the icon to view the data for home voltages and generator voltages
et p, be the population mean home voltage and let u, be the population mean generator voltage. What are the null and alternative hypotheses?
OA H₂1₂
OB. HP P₂
H₂:₂₂
H₁ H₂ = 1/₂
OC. He #₂
H₁: My P₂
OD. H₂ HP₂
H₁: ₂₂
Calculate the test statistic
1-(Round to three decimal places as needed.)
Find the P-value
P-value (Round to four decimal places as needed)
Make a conclusion about the null hypothesis and a final conclusion that addresses the original claim.
YH, There
mean. The deference
sufficient evidence to warrant rejection of the claim that the sample of home voltages and the sample of generator voltages are from populations with the same
statistically significant
Expert Solution
This question has been solved!
Explore an expertly crafted, step-by-step solution for a thorough understanding of key concepts.

This is a popular solution!

Trending now
This is a popular solution!

Step by step
Solved in 6 steps

Recommended textbooks for you
Glencoe Algebra 1, Student Edition, 9780079039897…
Algebra
ISBN:
9780079039897
Author:
Carter
Publisher:
McGraw Hill
Glencoe Algebra 1, Student Edition, 9780079039897…
Algebra
ISBN:
9780079039897
Author:
Carter
Publisher:
McGraw Hill