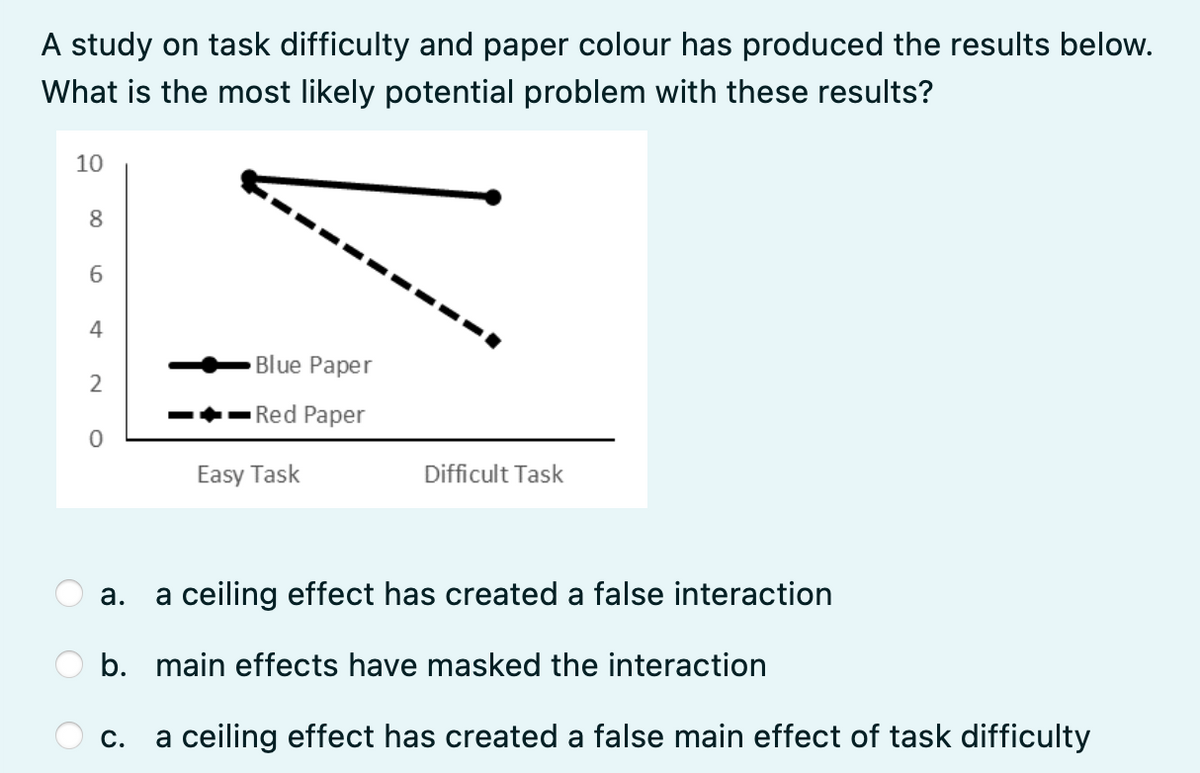
A study on task difficulty and paper colour has produced the results below. What is the most likely potential problem with these results? 10 8 6 4 2 0 Blue Paper Red Paper Easy Task Difficult Task a. a ceiling effect has created a false interaction b. main effects have masked the interaction C. a ceiling effect has created a false main effect of task difficulty


Q: Plot X & Y axis as a scatter plot and describe the plotted data. Calculation (no changes here): Does…
A: Given, data on rainfall and crop yield To make a scatter plot To make regression equations and…
Q: Exercise 13. Let X₁, X₂₁~ N(H₂,o2) i.i.d. and Y₁,...,Y~N(₂, ²) i.i.d. with known o². We assume that…
A: Given Xi~N(μx,σ2) ,Yi~N(uy,σ2)Corr(XiYi)=12D=Xi-Yi Show Cov(XiYi)=σ22 Determine E(D) and Var(D)…
Q: Corporate triple-A bond interest rates for 12 consecutive months follow. O (a) Construct a time…
A: Given information: Month Interest rate 1 9.6 2 9.4 3 9.5 4 9.6 5 9.9 6 9.7 7 9.8…
Q: Find the area of the shaded region. The graph depicts the standard normal distribution of bone…
A: given data normal distributionμ = 0σ = 1so its standard normal distribution where Z~N(0,1)shaded…
Q: Given this, what fraction of NHL players (who played an 82 game season) scored more than 45 goals?…
A: Let X be the random variable that scores the NHL player. Given that, X~N(μ=42, σ=8)
Q: An airline developed a regression model to predict revenue from flights that connect "feeder" cities…
A: a) The regression equation is, Estimated revenue = 81 + 0.3Distance + 1.4Population.
Q: A quiz consists of 10 multiple-choice questions, each with 6 possible answers. For someone who makes…
A: given data n=10 question each with 6 possible answer. p(correct…
Q: A pharmaceutical company claims that their average entry-level salary is $50,000 per year. A…
A: The objective is to formulate a statistical test in order to validate if the company's average…
Q: a) Please choose the suitable control charts to test whether or not the process is in control. b) A…
A:
Q: b) Run an ANOVA test using the statistical software package of your choice to compare solvability of…
A: Let us assume alpha=0.05 that is level of significance is 0.05 Let us use R code to run the NAOVA…
Q: A programmer plans to develop a new software system. In planning for the operating system that he…
A: From the provided information, Confidence level = 99% Margin of error = 0.03
Q: ^ azine provided results from a poll of 2000 adults who were asked to identify their favorite pie.…
A: Given that Sample size =2000 NOTE:- According to bartleby guidelines expert can solve maximum three…
Q: Use a normal approximation to find the probability of the indicated number of voters. In this case,…
A: Solution: - Let X be the number of eligible voters at the age 18 - 24. The probability of eligible…
Q: For the following questions, THERE IS NO NEED FOR EXPLANATION. PLEASE PROVIDE JUST THE ANSWER THANK…
A: Given that data 27 33 29 31
Q: The assessment of diet is an important exposure for many disease outcomes. However, there is often…
A: Please note that as per our guidelines if multiple sub-parts are there in a question we can answer…
Q: Based on anecdotal observations, they hypothesized that residents of the county tended to prefer…
A: Given Hypothesis is an assumption that is being tested.
Q: 8. Draw the graph of the distribution function of random variable & tak- ing values 1,...,n with…
A: We have to draw the graph of the distribution function of random variable ξ taking values x1,…
Q: 2. Identifying the independent-measures design Which of the following experiments uses independent…
A: Independent sample : It is the unpaired sample. It means that the values come from two or more…
Q: A progressive college experiments with matching roommates at random, regardless of gender or how…
A: The question is about conditional probability Given joint prob. distribution : To find : Knowing…
Q: What are the advantages and disadvantages of the square root sampling plan and the government…
A: The square root sampling plan and government sampling plan are two methods used in quality control…
Q: Consider a dice showing i with probability pi > 0 where i = 1, . . . , 6. The entropy of the…
A: This question deals with finding the probability distribution which minimizes the entropy of a dice…
Q: FOR THIS QUESTION, WOULD IT BE UNSUAL IF FEWER THAN 12 used GOOGLE? USE A CUTOFF OF 0.05
A: Answer:- Given, P( use the Google search engine) = 70% = 0.70 Sample size, n = 22 and p = 0.70…
Q: Let X represent the difference between the number of heads and the number of tails when a coin is…
A: Given that: Total number of times a coin tossed, n=36 To find: Probability of getting the difference…
Q: Let X be a random variable that follows the normal with mean of 80 and variance 49. d) Find ?x such…
A: We have given, Let X be a random variable that follows the normal distribution. The mean of μ=80…
Q: The following data represent the commute time (in minutes) x and a score on a well-being survey y.…
A: Given : The equation of the least squares regression line is y^ = -0.0468x + 68.9967 Standard error…
Q: Put some air in your tires: Let X represent the number of tires with low air pressure on a…
A: Given data : X 0 1 2 3 4 Px 0.3 0.1 0.3 0.1 0.2
Q: An engineer is going to redesign an ejection seat for an airplane. The seat was designed for pilots…
A: Given that, The random variable X is the weights of new pilots. It is normally distributed.…
Q: The thickness (in millimeters) of the coating applied to hard drives is one characteristic that…
A: Hi! Thank you for the question. As per the honor code, we are allowed to answer three sub-parts at a…
Q: An elevator has a placard stating that the maximum capacity is 1352 lb-8 passengers. So, 8 adult…
A: given data, normal distribution σ=28μ=171n=8p(x¯>169)=?
Q: The graph of a probability distribution is shown below. The graph is made up of two line segments…
A: Given : The graph of a probability distribution, with two line segments and one curve. To find :…
Q: K The probability of flu symptoms for a person not receiving any treatment is 0.039. In a clinical…
A: We have given that Probability (p) = 0.039n = 884
Q: Predict the value of a baseball franchise that generates $200 million of annual revenue. b. Given…
A: Given the data of associating values and annual revenue and the regression model with associating…
Q: Consider a population consisting of the following five values, which represent the number of video…
A: Given data set is: 9 15 17 11 12 we know that, mean= ΣXi/n Here sample size is n= 2
Q: Archeologists have studied sizes of Egyptian skulls in an attempt to determine whether breeding…
A: Data given 127.9,137.8,126.3,132.3,142.6,135.3,138.9,128.9
Q: right tailed t-test; df: 10, alpha: 0.05
A: Given right tailed t-test α=0.05 d.f.=10
Q: ← Find (a) the range and (b) the standard deviation of the set of data. 7, 13, 3, 5, 7, 12,9 (a) The…
A: We have given that, The data set are :- 7, 13, 3, 5, 7, 12, 9 Then,
Q: Given that: Hx= 1 100-x for 0<x<100 2 calculate the value of 30950:60-
A: ANSWER: The expression 30q_{50/60}^2 refers to the 50/60 quantile of the distribution of X^2, where…
Q: Unstack the data from the variables Cr. hours and Age into two columns labeled Full time and Part…
A: Given data is Cr.Hrs. Age 7 36 9 17 9 19 9 21 12 20 6 20 6 22 12 21 9 21 6 16…
Q: A random variable is normally distributed with a mean of - 90 and a standard deviation of a = 5. (a)…
A: From given mean μ=90 standard deviation σ=5
Q: Wallace asked 30 participants to report on their political affiliation by marking "1" for liberal,…
A: Given that 30 participants For liberal 1 For conservative 2 For not interested in poltics at all…
Q: In a science fair project, Emily conducted an experiment in which she tested professional touch…
A: (a) Obtain the proportion of correct responses that would be expected if the random guesses made…
Q: (a) What percent of the department faculty have less than 25 years of service? Answer: (b) If a…
A: Given that: From the histogram, fetch the data in tabular form: Class Number of faculty…
Q: Is there any significant evidence that the the alternative hypothesis is true?
A: Given that, The hypothesis for the test is, H0:Md=0 Vs H1:Md>0 n=15 T- = 19…
Q: The amount of time it takes Renee to go grocery shopping is continuous and uniformly distributed…
A: Given that X~U(a,b) a=18.5 , b=40.5
Q: How did you get part B?
A: By using probability distribution we will solving the part(b) as
Q: Susan has been on a bowling team for 14 years. After examining all of her scores over that period of…
A: We are given information, Let, X=scores over that period of time The random variable X follows a…
Q: 214.26 356.79 424.96 231.51 353.89 552.75 281.93 303.66 518.15 234.62 336.36 514.07 246.55 341.26…
A: * SOLUTION :- The given information is 214.26 356.79 424.96 231.51 353.89 552.75 281.93 303.66…
Q: A clinical trial tests a method designed to increase the probability of conceiving a girl. In the…
A: We have given that, Sample size (n) = 540 and favorable cases (x) = 270 Then, 99% confidence…
Q: Susan has been on a bowling team for 14 years. After examining all of her scores over that period of…
A: The mean is 225 and standard deviation is 13.
Q: A professor believes that students at her large university who exercise daily perform better in…
A: The given question is about a professor who believes that students who exercise daily perform better…

Step by step
Solved in 2 steps

- An amusement park studied methods for decreasing the waiting time (minutes) for rides by loading and unloading riders more efficiently.Tvo alternative loading/unloading methods have been proposed. To account for potential differences due to the type of the ride and the possible interaction between the method of loading and unloading and the type of ride, a factorial experiment was designed. Use the following data to test for any significant effect due to the loading and unloading method, the type of ride, and interaction. Use a = .05.Stephens, atkins, and Kingston, 2009 conducted an experiment in which participants were able to tolerate moore pain when they were shouting their favorite swear word than when they were shouting neutral words, Identify the dependent and independent variables for this studyStudents in QSO 510 are assigned to observe the effect of various types of music on relaxation mood in patients who are in the early and middle stages of Alzheimer's disease at a certain Nursing Home facility. A number of patients were selected to participate in the study based on their stages of Alzheimer's disease. Three forms of music were tested: R&B, Blues, and Reggae. While listening to music, relaxation levels were recorded for the patients with a high score indicating a higher level of relaxation. Scores are recorded below. Group Reggae Blues R&B Early Stage Alzheimer's 2124221820 9121059 2926302426 Middle Stage Alzheimer's 2220251820 141811913 1518201319 Use Excel’s ToolPak to compute Two-Way ANOVA and submit your statistical output. Are there any significant main effects or an interaction effect? Interpret your answer.
- A research article on the effect of multitasking on grade performance describes an experiment in which 62 undergraduate business students were randomly assigned to one of two experimental groups. Students in one group were asked to listen to a lecture but were told that they were permitted to use cell phones to send text messages during the lecture. Students in the second group listened to the same lecture but were not permitted to send text messages. Afterwards, students in both groups took a quiz on material covered in the lecture. Data from this experiment are summarized in the accompanying table.A restaurant manager conducts a survey to find if there is any relationship between service quality rating and income level of his guests. the income is classified as low, medium, High and the quality of service as poor, good or excellent. The results of the survey are summarized in the file Quality Service. Based on the data collected can we conclude that the client service quality rating is independent of his or her level of income ? perform in jasp a hypothesis test at a 0.05 level of signifiance. state your hypethesis and interpret your results. LEVEL OF INCOME POOR GOOD EXCELLENT TOTALLOW 23 14 8 45MEDIUM 20 25 40 85HIGH 10 15 20 45TOTAL 53 54 68 175W. Thomas Boyce, a professor and pediatrician at the University of British Columbia, Vancouver, has studied interactions between individual differences in physiology and differences in experience in determining health and well-being. Dr. Boyce found that some children are more sensitive to their environments. They do exceptionally well when the environment is supportive but are much more likely to have mental and physical health problems when the environment has challenges. You decide to do a similar study, conducting a factorial experiment to test the effectiveness of one environmental factor and one physiological factor on a physical health outcome. As the environmental factor, you choose two levels of stressful life events. As the physiological factor, you choose three levels of immune reactivity. The outcome is number of respiratory illnesses in the previous 12 months, and the research participants are kindergartners.
- The exercise involving data in this and subsequent sections were designed to be solved using Excel. Johnson Filtration, Inc. provides maintenance service for water-filtration systems. Suppose that in addition to information on the number of months since the machine was serviced and whether a mechanical or an electrical repair was necessary, the managers obtained a list showing which repairperson performed the service. The revised data follow. Repair Time(hours) Months SinceLast Service Type ofRepair Repairperson 2.9 2 electrical Dave Newton 3.0 6 mechanical Dave Newton 4.8 8 electrical Bob Jones 1.8 3 mechanical Dave Newton 2.9 2 electrical Dave Newton 4.9 7 electrical Bob Jones 4.2 9 mechanical Bob Jones 4.8 8 mechanical Bob Jones 4.4 4 electrical Bob Jones 4.5 6 electrical Dave Newton Ignore for now the months since the last maintenance service (x1 ) and the repairperson…The survey results are displayed in the segmented bar chart. Does there appear to be an association between education level and belief in the theory of evolution? If so, what does it mean about these two variables?A factorial experiment was designed to test for any significant differences in the time needed to perform English to foreign language translations with two computerized language translations. Because the type of language translated was also considered a significant factor, translations wwre made both systems for three languages: Spanish, French, and German. Use the following data for translation time in hours. Spanish. French German Sys 1 12 14 15 16 18 19 Sys 2. 7 12 17 11 14 23 Test for any significant differences due to language translator system (Factor A), type of language (Factor B), and interactuon. Use a =.05. Complete the following ANOVA table (to 2 decimals, if necessary). Round your value to 4 decimal places. Attached is what I need help with. Thank you
- If there is an interaction between the variables of “activity level” and “time of day,” this means that activity level does not have the same effect at different times of day. Group of answer choices True FalseA study investigated the relationship between audit delay and variables that describe the client and the auditor. The file Audit contains data from a sample of 40 companies on the following set of variables: Delay: The length of time from a company's fiscal year-end to the date of the auditor's report. Industry: A dummy variable coded 1 if the firm was an industrial company or 0 if the firm was a bank, savings and loan, or insurance company. Public: A dummy variable coded 1 if the company was traded on an organized exchange or over the counter; otherwise coded 0. Quality: A measure of overall quality of internal controls, as judged by the auditor, on a five-point scale ranging from "virtually none" (1) to "excellent" (5). Finished: A measure ranging from 1 to 4, as judged by the auditor, where 1 indicates "all work performed subsequent to year-end" and indicates 4 "most work performed prior to year-end." Click on the datafile logo to reference the data. Consider a model in which…Motivational speakers want to be perceived as trustworthy. One hypothesis is that speakers who exhibit immediacy behaviors such as making eye contact, smiling and leaning forward might be perceived as more trustworthy than those who do not engage in these behaviors. To test this hypothesis, a psychologist obtained data from 26 participants. For people in a non-immediacy group, the speaker did not engage in any immediacy behaviors. For the immediacy group, however, the speaker made eye contact, smiled and leaned forward while giving a speech. After the speech, participants rated the speaker on a scale of trustworthiness ranging from 1 (not at all trustworthy) to 9 (highly trustworthy). The following data were obtained. Test whether the immediacy behaviors of the speaker affect trustworthiness rating. No immediacy behavior Immediacy behavior 4 4 7 4 5 3 6 5 3 5 9 8 4 6 8 7 6 3 8 6 7 5 7 8 7 6…