Click the icon to view the table. a survey participant is selected at random, what is the probability that he or she is satisfied with student government? tisfied) = nd to three decimal places as needed.) Data Table Freshman Sophomore 48 Junior Senior 63 Total Satisfied 55 60 226 Neutral 29 13 13 15 70 Not satisfled 23 23 13 25 84
Click the icon to view the table. a survey participant is selected at random, what is the probability that he or she is satisfied with student government? tisfied) = nd to three decimal places as needed.) Data Table Freshman Sophomore 48 Junior Senior 63 Total Satisfied 55 60 226 Neutral 29 13 13 15 70 Not satisfled 23 23 13 25 84

Chapter8: Sequences, Series,and Probability
Section8.7: Probability
Problem 50E: Flexible Work Hours In a recent survey, people were asked whether they would prefer to work flexible...

Related questions
Question
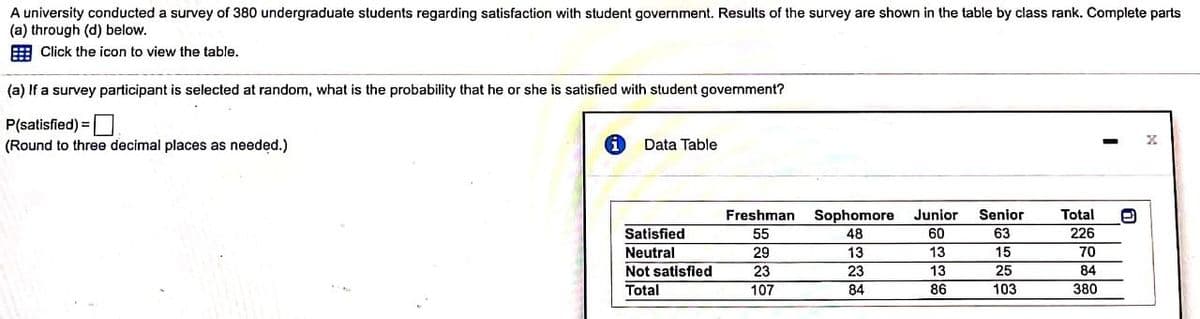
Transcribed Image Text:A university conducted a survey of 380 undergraduate students regarding satisfaction with student government. Results of the survey are shown in the table by class rank. Complete parts
(a) through (d) below.
E Click the icon to view the table.
(a) If a survey participant is selected at random, what is the probability that he or she is satisfied with student government?
P(satisfied) =
(Round to three decimal places as needed.)
Data Table
Freshman
Sophomore
Junior
Senior
Total
Satisfied
55
48
60
63
226
Neutral
29
23
107
13
13
15
70
Not satisfled
23
13
25
84
Total
84
86
103
380
Expert Solution
This question has been solved!
Explore an expertly crafted, step-by-step solution for a thorough understanding of key concepts.

This is a popular solution!

Trending now
This is a popular solution!

Step by step
Solved in 2 steps with 1 images

Recommended textbooks for you