coefficients when the returns of the size-institutional ownership portfolio (columns 1 and 2) returns are regressed on three variables: a constant (column 3), the stock market returns (column 4), and the change of the value weighted discount of the closed end fund industry (column 6). Columns 5 and 7 report the corresponding t- statistics of the coefficient estimates
coefficients when the returns of the size-institutional ownership portfolio (columns 1 and 2) returns are regressed on three variables: a constant (column 3), the stock market returns (column 4), and the change of the value weighted discount of the closed end fund industry (column 6). Columns 5 and 7 report the corresponding t- statistics of the coefficient estimates

MATLAB: An Introduction with Applications
6th Edition
ISBN:9781119256830
Author:Amos Gilat
Publisher:Amos Gilat
Chapter1: Starting With Matlab
Section: Chapter Questions
Problem 1P

Related questions
Question
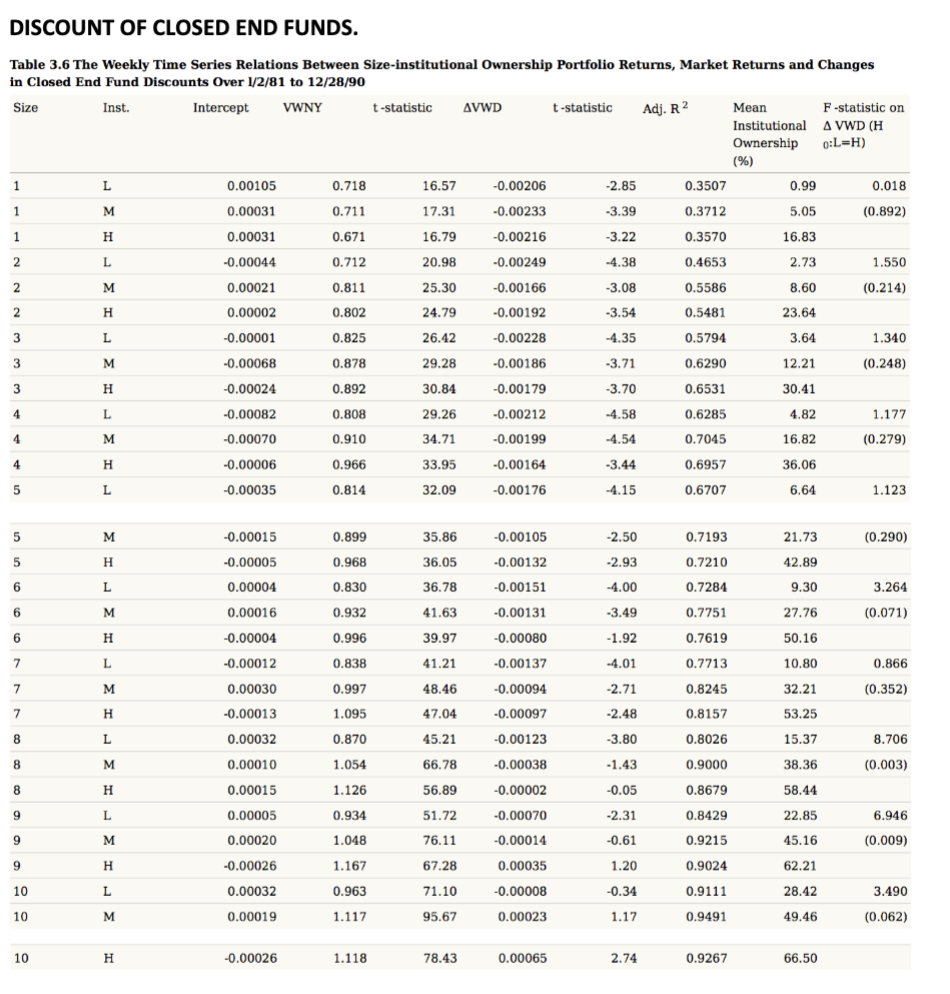
This table reports the regression coefficients when the returns of the size-institutional
ownership portfolio (columns 1 and 2) returns are regressed on three variables: a constant
(column 3), the stock market returns (column 4), and the change of the value weighted discount
of the closed end fund industry (column 6). Columns 5 and 7 report the corresponding t-
statistics of the coefficient estimates. Note that a t-statistic with an absolute value above 1.96
means the coefficient estimate is significantly different from 0 at the 1% level. Column 8
reports the R square of the regressions. Column 9 reports the mean institutional ownership of
each portfolio. The last column reports the F-statistics for a multivariate test of the null
hypothesis that the coefficient on ΔVWD in the Low (L) ownership portfolio is equal to the
High (H) ownership portfolio. Two-tailed p-values are in parentheses.
High (H) ownership portfolio. Two-tailed p-values are in parentheses.
1. What is the main finding of this Table?
2. What is the explanation for the finding?
Transcribed Image Text:DISCOUNT OF CLOSED END FUNDS.
Table 3.6 The Weekly Time Series Relations Between Size-institutional Ownership Portfolio Returns, Market Returns and Changes
in Closed End Fund Discounts Over 1/2/81 to 12/28/90
Size
Inst.
Intercept
VWNY
1
1
1
2
2
2
3
3
3
4
4
4
5
5
5
6
6
6
7
7
7
8
8
8
9
9
9
10
10
10
L
M
H
L
M
H
L
M
H
L
M
H
L
M
H
L
M
H
L
M
H
L
M
H
L
M
H
L
M
H
0.00105
0.00031
0.00031
-0.00044
0.00021
0.00002
-0.00001
-0.00068
-0.00024
-0.00082
-0.00070
-0.00006
-0.00035
-0.00015
-0.00005
0.00004
0.00016
-0.00004
-0.00012
0.00030
-0.00013
0.00032
0.00010
0.00015
0.00005
0.00020
-0.00026
0.00032
0.00019
-0.00026
0.718
0.711
0.671
0.712
0.811
0.802
0.825
0.878
0.892
0.808
0.910
0.966
0.814
0.899
0.968
0.830
0.932
0.996
0.838
0.997
1.095
0.870
1.054
1.126
0.934
1.048
1.167
0.963
1.117
1.118
t-statistic
16.57
17.31
16.79
20.98
25.30
24.79
26.42
29.28
30.84
29.26
34.71
33.95
32.09
35.86
36.05
36.78
41.63
39.97
41.21
48.46
47.04
45.21
66.78
56.89
51.72
76.11
67.28
71.10
95.67
78.43
AVWD
-0.00206
-0.00233
-0.00216
-0.00249
-0.00166
-0.00192
-0.00228
-0.00186
-0.00179
-0.00212
-0.00199
-0.00164
-0.00176
-0.00105
-0.00132
-0.00151
-0.00131
-0.00080
-0.00137
-0.00094
-0.00097
-0.00123
-0.00038
-0.00002
-0.00070
-0.00014
0.00035
-0.00008
0.00023
0.00065
t-statistic
-2.85
-3.39
-3.22
-4.38
-3.08
-3.54
-4.35
-3.71
-3.70
-4.58
-4.54
-3.44
-4.15
-2.50
-2.93
-4.00
-3.49
-1.92
-4.01
-2.71
-2.48
-3.80
-1.43
-0.05
-2.31
-0.61
1.20
-0.34
1.17
2.74
Adj. R2
0.3507
0.3712
0.3570
0.4653
0.5586
0.5481
0.5794
0.6290
0.6531
0.6285
0.7045
0.6957
0.6707
0.7193
0.7210
0.7284
0.7751
0.7619
0.7713
0.8245
0.8157
0.8026
0.9000
0.8679
0.8429
0.9215
0.9024
0.9111
0.9491
0.9267
Mean
Institutional
Ownership 0:L=H)
(%)
0.99
5.05
16.83
2.73
8.60
23.64
3.64
12.21
30.41
4.82
16.82
36.06
6.64
21.73
42.89
9.30
27.76
50.16
10.80
32.21
53.25
15.37
38.36
58.44
22.85
45.16
62.21
28.42
49.46
F-statistic on
A VWD (H
66.50
0.018
(0.892)
1.550
(0.214)
1.340
(0.248)
1.177
(0.279)
1.123
(0.290)
3.264
(0.071)
0.866
(0.352)
8.706
(0.003)
6.946
(0.009)
3.490
(0.062)
Expert Solution
This question has been solved!
Explore an expertly crafted, step-by-step solution for a thorough understanding of key concepts.

Step by step
Solved in 3 steps

Recommended textbooks for you
MATLAB: An Introduction with Applications
Statistics
ISBN:
9781119256830
Author:
Amos Gilat
Publisher:
John Wiley & Sons Inc

Probability and Statistics for Engineering and th…
Statistics
ISBN:
9781305251809
Author:
Jay L. Devore
Publisher:
Cengage Learning

Statistics for The Behavioral Sciences (MindTap C…
Statistics
ISBN:
9781305504912
Author:
Frederick J Gravetter, Larry B. Wallnau
Publisher:
Cengage Learning
MATLAB: An Introduction with Applications
Statistics
ISBN:
9781119256830
Author:
Amos Gilat
Publisher:
John Wiley & Sons Inc
Probability and Statistics for Engineering and th…
Statistics
ISBN:
9781305251809
Author:
Jay L. Devore
Publisher:
Cengage Learning
Statistics for The Behavioral Sciences (MindTap C…
Statistics
ISBN:
9781305504912
Author:
Frederick J Gravetter, Larry B. Wallnau
Publisher:
Cengage Learning

Elementary Statistics: Picturing the World (7th E…
Statistics
ISBN:
9780134683416
Author:
Ron Larson, Betsy Farber
Publisher:
PEARSON

The Basic Practice of Statistics
Statistics
ISBN:
9781319042578
Author:
David S. Moore, William I. Notz, Michael A. Fligner
Publisher:
W. H. Freeman

Introduction to the Practice of Statistics
Statistics
ISBN:
9781319013387
Author:
David S. Moore, George P. McCabe, Bruce A. Craig
Publisher:
W. H. Freeman