College tuition: The mean annual tuition and fees in the 2013-2014 academic year for a sample of 22 private colleges in California was $33,750 with a standard devilation of $7400, A dotplot shows that it is reasonable to assume that the population is approximately normal. Can you conclude that the mean tuition and fees for private institutions in California is less than S35,000? Use the a0.05 level of significance and the critical value method with the Critical Values for the Student's t Distribution Table. Part: 0/5 Part 1 of 5 (a) State the appropriate null and alternate hypotheses. This hypothesis test is a (Choose one) test. left-tailed right-tailed two-tailed
College tuition: The mean annual tuition and fees in the 2013-2014 academic year for a sample of 22 private colleges in California was $33,750 with a standard devilation of $7400, A dotplot shows that it is reasonable to assume that the population is approximately normal. Can you conclude that the mean tuition and fees for private institutions in California is less than S35,000? Use the a0.05 level of significance and the critical value method with the Critical Values for the Student's t Distribution Table. Part: 0/5 Part 1 of 5 (a) State the appropriate null and alternate hypotheses. This hypothesis test is a (Choose one) test. left-tailed right-tailed two-tailed

MATLAB: An Introduction with Applications
6th Edition
ISBN:9781119256830
Author:Amos Gilat
Publisher:Amos Gilat
Chapter1: Starting With Matlab
Section: Chapter Questions
Problem 1P

Related questions
Question
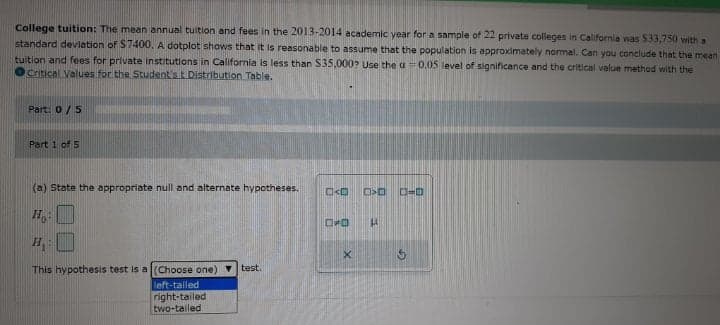
Transcribed Image Text:College tuition: The mean annual tuition and fees in the 2013-2014 academic year for a sample of 22 private colleges in California was S33,750 with a
standard deviation of S7400, A dotplot shows that it is reasonable to assume that the population is approximately normal. Can you conclude that the mean
tuition and fees for private institutions in California is less than S35,000? Use the a 0.05 level of significance and the critical value method with the
O Critical Values for the Student's t Distribution Table.
Part: 0/5
Part 1 of 5
(a) State the appropriate null and alternate hypotheses.
D=D
This hypothesis test is a
(Choose one) test.
left-talled
right-tailed
two-tailed
Expert Solution
This question has been solved!
Explore an expertly crafted, step-by-step solution for a thorough understanding of key concepts.

This is a popular solution!

Trending now
This is a popular solution!

Step by step
Solved in 2 steps

Recommended textbooks for you
MATLAB: An Introduction with Applications
Statistics
ISBN:
9781119256830
Author:
Amos Gilat
Publisher:
John Wiley & Sons Inc

Probability and Statistics for Engineering and th…
Statistics
ISBN:
9781305251809
Author:
Jay L. Devore
Publisher:
Cengage Learning

Statistics for The Behavioral Sciences (MindTap C…
Statistics
ISBN:
9781305504912
Author:
Frederick J Gravetter, Larry B. Wallnau
Publisher:
Cengage Learning
MATLAB: An Introduction with Applications
Statistics
ISBN:
9781119256830
Author:
Amos Gilat
Publisher:
John Wiley & Sons Inc
Probability and Statistics for Engineering and th…
Statistics
ISBN:
9781305251809
Author:
Jay L. Devore
Publisher:
Cengage Learning
Statistics for The Behavioral Sciences (MindTap C…
Statistics
ISBN:
9781305504912
Author:
Frederick J Gravetter, Larry B. Wallnau
Publisher:
Cengage Learning

Elementary Statistics: Picturing the World (7th E…
Statistics
ISBN:
9780134683416
Author:
Ron Larson, Betsy Farber
Publisher:
PEARSON

The Basic Practice of Statistics
Statistics
ISBN:
9781319042578
Author:
David S. Moore, William I. Notz, Michael A. Fligner
Publisher:
W. H. Freeman

Introduction to the Practice of Statistics
Statistics
ISBN:
9781319013387
Author:
David S. Moore, George P. McCabe, Bruce A. Craig
Publisher:
W. H. Freeman