Com 120.000 80.000 40.000 A Robots 5.000 10.000 15.000 In the graph above, the opportunity cost of producing one more robot is 1 corn. 8 corn. 5,000 corn. 15,000 corn.
Com 120.000 80.000 40.000 A Robots 5.000 10.000 15.000 In the graph above, the opportunity cost of producing one more robot is 1 corn. 8 corn. 5,000 corn. 15,000 corn.

Chapter2: Scarcity And Opportunity Costs
Section: Chapter Questions
Problem 10E

Related questions

Question
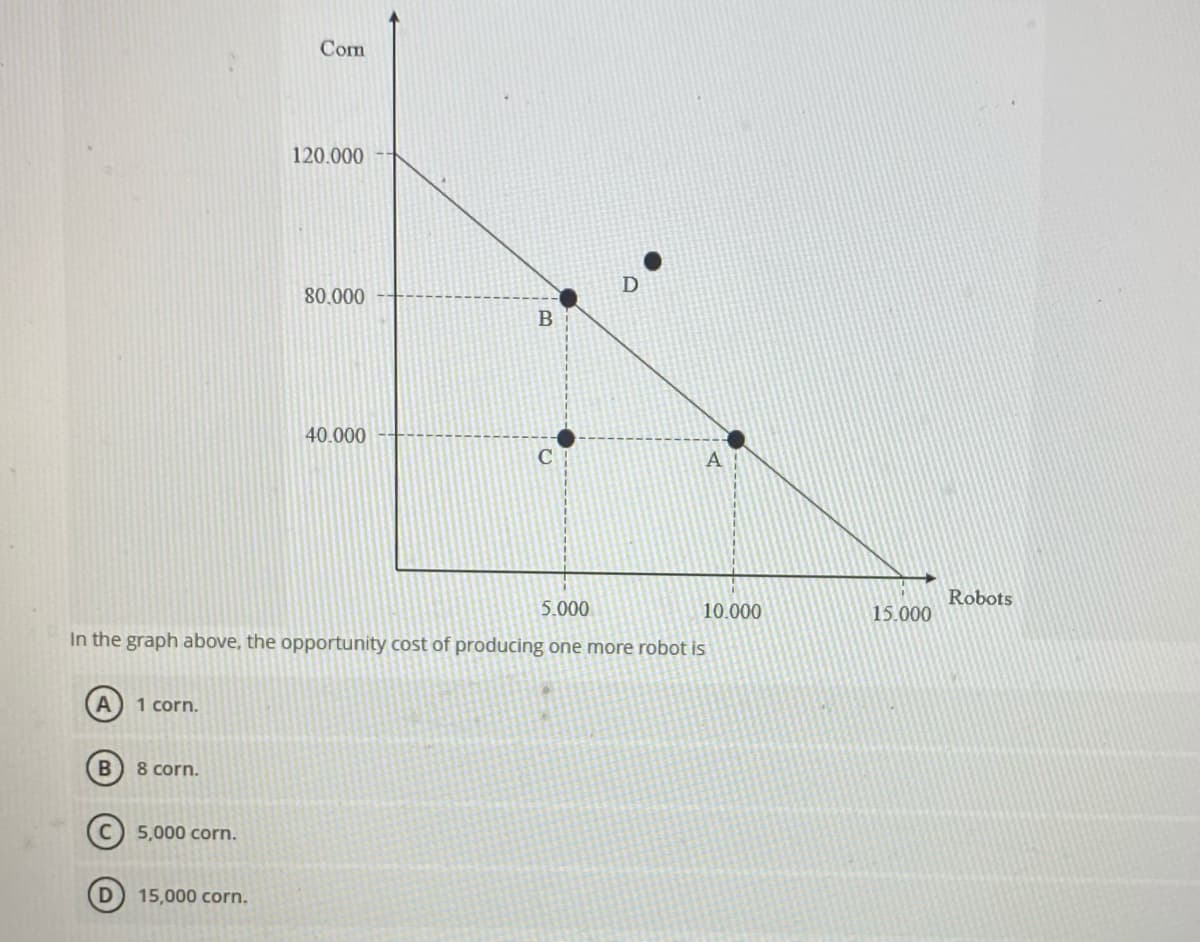
Transcribed Image Text:Com
120.000
80.000
40.000
Robots
5.000
10.000
15.000
In the graph above, the opportunity cost of producing one more robot is
A
1 corn.
8 corn.
5,000 corn.
15,000 corn.
Expert Solution
This question has been solved!
Explore an expertly crafted, step-by-step solution for a thorough understanding of key concepts.

This is a popular solution!

Trending now
This is a popular solution!

Step by step
Solved in 2 steps

Knowledge Booster


Learn more about
Need a deep-dive on the concept behind this application? Look no further. Learn more about this topic, economics and related others by exploring similar questions and additional content below.Recommended textbooks for you

Brief Principles of Macroeconomics (MindTap Cours…
Economics
ISBN:
9781337091985
Author:
N. Gregory Mankiw
Publisher:
Cengage Learning

Essentials of Economics (MindTap Course List)
Economics
ISBN:
9781337091992
Author:
N. Gregory Mankiw
Publisher:
Cengage Learning
Brief Principles of Macroeconomics (MindTap Cours…
Economics
ISBN:
9781337091985
Author:
N. Gregory Mankiw
Publisher:
Cengage Learning
Essentials of Economics (MindTap Course List)
Economics
ISBN:
9781337091992
Author:
N. Gregory Mankiw
Publisher:
Cengage Learning


