Common-Size and Forecast Income Statements Refer to the income statements for The Gap, Inc., presented below. a. Prepare common-size income statements for fiscal years 2014 (ending January 31, 2015) and 2013 (ending February 1, 2014). Round answers to one decimal place (i.e., 0.2568 = 25.7%). The Gap, Inc. Common-Size Income Statements Fiscal year ended Jan. 31, 2015 Feb. 1, 2014 Net sales $16,435 þ% $16,148 0% Cost of goods sold & occupancy expenses 10,146 0 % 9,855 0% Gross profit 6,289 0% 6,293 0% Operating expenses 4,206 0 % 4,144 0 % Operating income 2,083 0% 2,149 0% Interest expense 75 0 % 61 0 % Interest income (5) 0 % (5) 0% Income before income taxes 2,013 0 % 2,093 0% Income taxes 751 0 % 813 0% Net earnings $1,262 0 % $1,280 0 % b. Prepare an income statement forecast for the fiscal year 2015 (ending January 30, 2016), based on the following assumptions: • Net sales total $15,000 million. • Cost of goods sold and occupancy expenses are 64% of sales. • Operating expenses total 26% of sales. • Interest income and interest expense are unchanged from the 2014 amounts. • The Gap's effective tax rate is 39%. Comparing Profitability Ratios for Competitors Selected income statement data for Abbott Laboratories, Bristol-Myers Squibb Company, Johnson & Johnson, GlaxoSmithKline plc, and Pfizer, Inc. is presented in the following table: Bristol- Johnson Glaxo Abbott Мyers & Smith ($ illions) Laboratories Squibb Johnson Kline plc Pfizer Sales revenue $39,001 $21,394 $65,280 £27,537 $67,675 Cost of sales 15,541 5,598 20,360 7,332 15,085 SG&A expense 12,757 5,160 20,969 8,826 19,468 R&D expense 4,129 3,839 7,548 4,009 9,112 Interest expense 530 145 571 799 1,681 Net income 4,728 5,260 9,672 5,458 10,051 Required a. Compute the profit margin (PM) and gross profit margin (GPM) ratios for each company. (As a British company, GlaxoSmithKline plc has a statutory tax rate of 26.5% in 2014; assume a statutory rate of 35% for all other companies.) (Round your answers to one decimal place.) Bristol- Johnson Glaxo Smith Мyers Laboratories Squibb Abbott & Johnson Kline plc Pfizer PM 0 % 0 % 0 % 0 % 0 % GPM 0 % 0 % 0 % 0 % 0% b. Compute the research and development (R&D) expense to sales ratio and the selling, general and administrative (SG&A) expense to sales ratio for each company. (Round your answers to one decimal place.) Bristol- Johnson Glaxo Abbott Myers Squibb & Smith Laboratories Johnson Kline plc Pfizer R&D ETS 0% 0 % 0% 0 % 0% SG&A ETS 0% 0 % 0 % 0% 0%
Common-Size and Forecast Income Statements Refer to the income statements for The Gap, Inc., presented below. a. Prepare common-size income statements for fiscal years 2014 (ending January 31, 2015) and 2013 (ending February 1, 2014). Round answers to one decimal place (i.e., 0.2568 = 25.7%). The Gap, Inc. Common-Size Income Statements Fiscal year ended Jan. 31, 2015 Feb. 1, 2014 Net sales $16,435 þ% $16,148 0% Cost of goods sold & occupancy expenses 10,146 0 % 9,855 0% Gross profit 6,289 0% 6,293 0% Operating expenses 4,206 0 % 4,144 0 % Operating income 2,083 0% 2,149 0% Interest expense 75 0 % 61 0 % Interest income (5) 0 % (5) 0% Income before income taxes 2,013 0 % 2,093 0% Income taxes 751 0 % 813 0% Net earnings $1,262 0 % $1,280 0 % b. Prepare an income statement forecast for the fiscal year 2015 (ending January 30, 2016), based on the following assumptions: • Net sales total $15,000 million. • Cost of goods sold and occupancy expenses are 64% of sales. • Operating expenses total 26% of sales. • Interest income and interest expense are unchanged from the 2014 amounts. • The Gap's effective tax rate is 39%. Comparing Profitability Ratios for Competitors Selected income statement data for Abbott Laboratories, Bristol-Myers Squibb Company, Johnson & Johnson, GlaxoSmithKline plc, and Pfizer, Inc. is presented in the following table: Bristol- Johnson Glaxo Abbott Мyers & Smith ($ illions) Laboratories Squibb Johnson Kline plc Pfizer Sales revenue $39,001 $21,394 $65,280 £27,537 $67,675 Cost of sales 15,541 5,598 20,360 7,332 15,085 SG&A expense 12,757 5,160 20,969 8,826 19,468 R&D expense 4,129 3,839 7,548 4,009 9,112 Interest expense 530 145 571 799 1,681 Net income 4,728 5,260 9,672 5,458 10,051 Required a. Compute the profit margin (PM) and gross profit margin (GPM) ratios for each company. (As a British company, GlaxoSmithKline plc has a statutory tax rate of 26.5% in 2014; assume a statutory rate of 35% for all other companies.) (Round your answers to one decimal place.) Bristol- Johnson Glaxo Smith Мyers Laboratories Squibb Abbott & Johnson Kline plc Pfizer PM 0 % 0 % 0 % 0 % 0 % GPM 0 % 0 % 0 % 0 % 0% b. Compute the research and development (R&D) expense to sales ratio and the selling, general and administrative (SG&A) expense to sales ratio for each company. (Round your answers to one decimal place.) Bristol- Johnson Glaxo Abbott Myers Squibb & Smith Laboratories Johnson Kline plc Pfizer R&D ETS 0% 0 % 0% 0 % 0% SG&A ETS 0% 0 % 0 % 0% 0%

Financial Accounting
15th Edition
ISBN:9781337272124
Author:Carl Warren, James M. Reeve, Jonathan Duchac
Publisher:Carl Warren, James M. Reeve, Jonathan Duchac
Chapter2: Analyzing Transactions
Section: Chapter Questions
Problem 24E: The following data (in millions) were taken from the financial statements of Costco Wholesale...

Related questions
Question
For the first picture, I need help finding the decimal number beside each number
For the second picture I need assistance with the GPM, R&D ETS, SG&A ETS
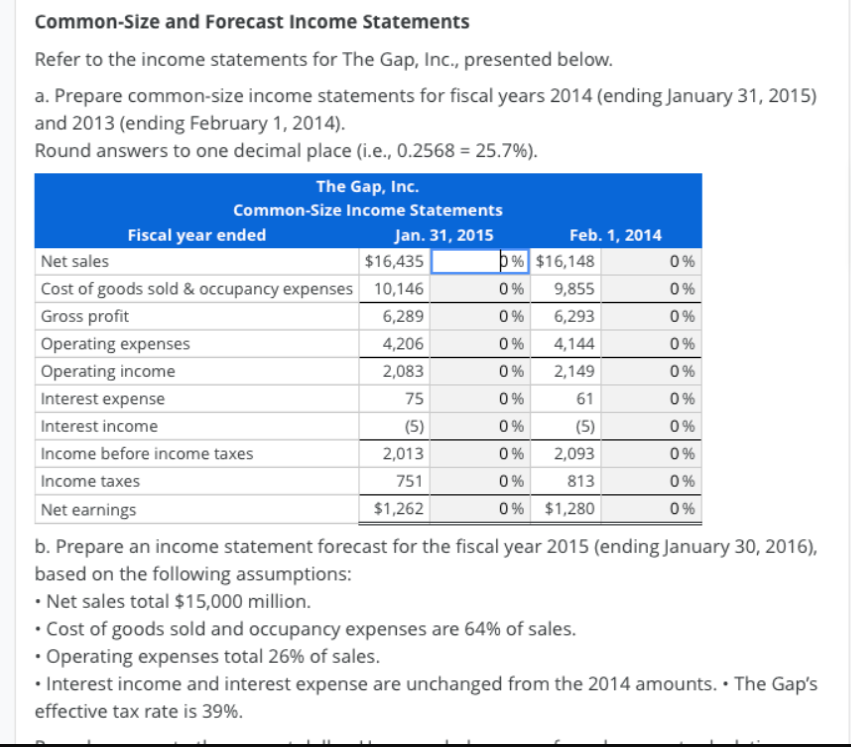
Transcribed Image Text:Common-Size and Forecast Income Statements
Refer to the income statements for The Gap, Inc., presented below.
a. Prepare common-size income statements for fiscal years 2014 (ending January 31, 2015)
and 2013 (ending February 1, 2014).
Round answers to one decimal place (i.e., 0.2568 = 25.7%).
The Gap, Inc.
Common-Size Income Statements
Fiscal year ended
Jan. 31, 2015
Feb. 1, 2014
Net sales
$16,435
þ% $16,148
0%
Cost of goods sold & occupancy expenses 10,146
0 %
9,855
0%
Gross profit
6,289
0%
6,293
0%
Operating expenses
4,206
0 %
4,144
0 %
Operating income
2,083
0%
2,149
0%
Interest expense
75
0 %
61
0 %
Interest income
(5)
0 %
(5)
0%
Income before income taxes
2,013
0 %
2,093
0%
Income taxes
751
0 %
813
0%
Net earnings
$1,262
0 % $1,280
0 %
b. Prepare an income statement forecast for the fiscal year 2015 (ending January 30, 2016),
based on the following assumptions:
• Net sales total $15,000 million.
• Cost of goods sold and occupancy expenses are 64% of sales.
• Operating expenses total 26% of sales.
• Interest income and interest expense are unchanged from the 2014 amounts. • The Gap's
effective tax rate is 39%.
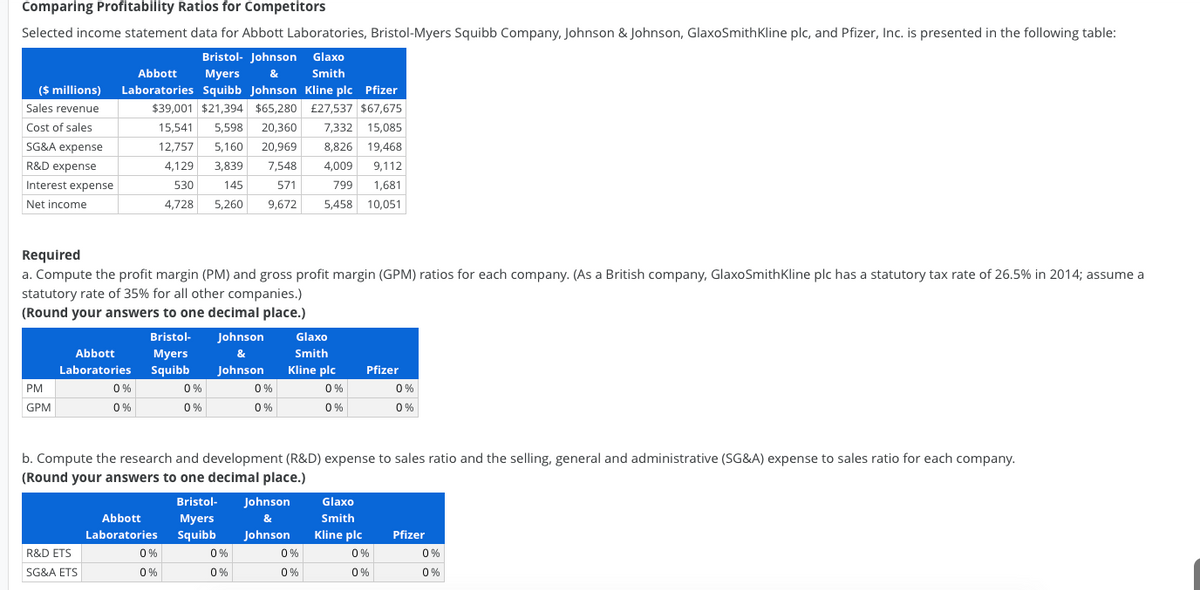
Transcribed Image Text:Comparing Profitability Ratios for Competitors
Selected income statement data for Abbott Laboratories, Bristol-Myers Squibb Company, Johnson & Johnson, GlaxoSmithKline plc, and Pfizer, Inc. is presented in the following table:
Bristol- Johnson Glaxo
Abbott
Мyers
&
Smith
($ illions) Laboratories Squibb Johnson Kline plc Pfizer
Sales revenue
$39,001 $21,394 $65,280 £27,537 $67,675
Cost of sales
15,541
5,598
20,360
7,332 15,085
SG&A expense
12,757
5,160
20,969
8,826 19,468
R&D expense
4,129
3,839
7,548
4,009
9,112
Interest expense
530
145
571
799
1,681
Net income
4,728
5,260
9,672
5,458 10,051
Required
a. Compute the profit margin (PM) and gross profit margin (GPM) ratios for each company. (As a British company, GlaxoSmithKline plc has a statutory tax rate of 26.5% in 2014; assume a
statutory rate of 35% for all other companies.)
(Round your answers to one decimal place.)
Bristol-
Johnson
Glaxo
Smith
Мyers
Laboratories Squibb
Abbott
&
Johnson
Kline plc
Pfizer
PM
0 %
0 %
0 %
0 %
0 %
GPM
0 %
0 %
0 %
0 %
0%
b. Compute the research and development (R&D) expense to sales ratio and the selling, general and administrative (SG&A) expense to sales ratio for each company.
(Round your answers to one decimal place.)
Bristol-
Johnson
Glaxo
Abbott
Myers
Squibb
&
Smith
Laboratories
Johnson
Kline plc
Pfizer
R&D ETS
0%
0 %
0%
0 %
0%
SG&A ETS
0%
0 %
0 %
0%
0%
Expert Solution
This question has been solved!
Explore an expertly crafted, step-by-step solution for a thorough understanding of key concepts.

This is a popular solution!

Trending now
This is a popular solution!

Step by step
Solved in 3 steps

Knowledge Booster


Learn more about
Need a deep-dive on the concept behind this application? Look no further. Learn more about this topic, accounting and related others by exploring similar questions and additional content below.Recommended textbooks for you
Financial Accounting
Accounting
ISBN:
9781337272124
Author:
Carl Warren, James M. Reeve, Jonathan Duchac
Publisher:
Cengage Learning

Managerial Accounting: The Cornerstone of Busines…
Accounting
ISBN:
9781337115773
Author:
Maryanne M. Mowen, Don R. Hansen, Dan L. Heitger
Publisher:
Cengage Learning

Managerial Accounting
Accounting
ISBN:
9781337912020
Author:
Carl Warren, Ph.d. Cma William B. Tayler
Publisher:
South-Western College Pub
Financial Accounting
Accounting
ISBN:
9781337272124
Author:
Carl Warren, James M. Reeve, Jonathan Duchac
Publisher:
Cengage Learning
Managerial Accounting: The Cornerstone of Busines…
Accounting
ISBN:
9781337115773
Author:
Maryanne M. Mowen, Don R. Hansen, Dan L. Heitger
Publisher:
Cengage Learning
Managerial Accounting
Accounting
ISBN:
9781337912020
Author:
Carl Warren, Ph.d. Cma William B. Tayler
Publisher:
South-Western College Pub

Cornerstones of Financial Accounting
Accounting
ISBN:
9781337690881
Author:
Jay Rich, Jeff Jones
Publisher:
Cengage Learning


Financial And Managerial Accounting
Accounting
ISBN:
9781337902663
Author:
WARREN, Carl S.
Publisher:
Cengage Learning,