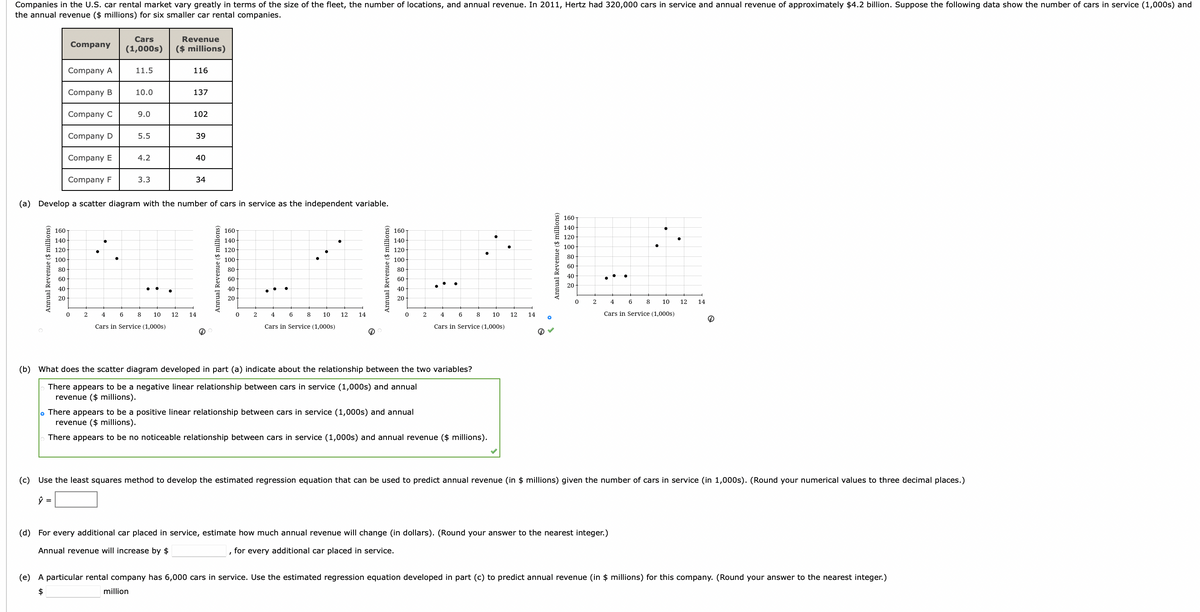
Companies in the U.S. car rental market vary greatly in terms of the size of the fleet, the number of locations, and annual revenue. In 2011, Hertz had 320,000 cars in service and annual revenue of approximately $4.2 billion. Suppose the following data show the number of cars in service (1,000s) and the annual revenue ($ millions) for six smaller car rental companies. Cars Revenue Company (1,000s) ($ millions) Company A 11.5 116 Company B 10.0 137 Company C 9.0 102 Company D 5.5 39 Company E 4.2 40 Company F 3.3 34 (a) Develop a scatter diagram with the number of cars in service as the independent variable. 160 140 160 140 120 1601 140 120 100 160 140 100 120 120 100 80 100 60 80 80 40 ... 60 ... 20 40 ... 40 ... 40 20 20 20 8 10 12 14 6 2 46 8 10 12 14 24 6 10 12 14 6 10 12 14 Cars in Service (1.000s Cars in Service (100o) Cars in Service (1,000s) Cars in Service (1.000s) (b) What does the scatter diagram developed in part (a) indicate about the relationship between the two variables? There appears to be a negative linear relationship between cars in service (1,000s) and annual revenue ($ millions). . There appears to be a positive linear relationship between cars in service (1,000s) and annual revenue ($ millions). There appears to be no noticeable relationship between cars in service (1,000s) and annual revenue ($ millions). (c) Use the least squares method to develop the estimated regression equation that can be used to predict annual revenue (in $ millions) given the number of cars in service (in 1,000s). (Round your numerical values to three decimal places.) (d) For every additional car placed in service, estimate how much annual revenue will change (in dollars). (Round your answer to the nearest integer.) Annual revenue will increase by $ for every additional car placed in service. (e) A particular rental company has 6,000 cars in service. Use the estimated regression equation developed in part (c) to predict annual revenue (in $ millions) for this company. (Round your answer to the nearest integer.) million
Companies in the U.S. car rental market vary greatly in terms of the size of the fleet, the number of locations, and annual revenue. In 2011, Hertz had 320,000 cars in service and annual revenue of approximately $4.2 billion. Suppose the following data show the number of cars in service (1,000s) and the annual revenue ($ millions) for six smaller car rental companies. Cars Revenue Company (1,000s) ($ millions) Company A 11.5 116 Company B 10.0 137 Company C 9.0 102 Company D 5.5 39 Company E 4.2 40 Company F 3.3 34 (a) Develop a scatter diagram with the number of cars in service as the independent variable. 160 140 160 140 120 1601 140 120 100 160 140 100 120 120 100 80 100 60 80 80 40 ... 60 ... 20 40 ... 40 ... 40 20 20 20 8 10 12 14 6 2 46 8 10 12 14 24 6 10 12 14 6 10 12 14 Cars in Service (1.000s Cars in Service (100o) Cars in Service (1,000s) Cars in Service (1.000s) (b) What does the scatter diagram developed in part (a) indicate about the relationship between the two variables? There appears to be a negative linear relationship between cars in service (1,000s) and annual revenue ($ millions). . There appears to be a positive linear relationship between cars in service (1,000s) and annual revenue ($ millions). There appears to be no noticeable relationship between cars in service (1,000s) and annual revenue ($ millions). (c) Use the least squares method to develop the estimated regression equation that can be used to predict annual revenue (in $ millions) given the number of cars in service (in 1,000s). (Round your numerical values to three decimal places.) (d) For every additional car placed in service, estimate how much annual revenue will change (in dollars). (Round your answer to the nearest integer.) Annual revenue will increase by $ for every additional car placed in service. (e) A particular rental company has 6,000 cars in service. Use the estimated regression equation developed in part (c) to predict annual revenue (in $ millions) for this company. (Round your answer to the nearest integer.) million

Linear Algebra: A Modern Introduction
4th Edition
ISBN:9781285463247
Author:David Poole
Publisher:David Poole
Chapter2: Systems Of Linear Equations
Section2.4: Applications
Problem 28EQ

Related questions
Question
Transcribed Image Text:Companies in the U.S. car rental market vary greatly in terms of the size of the fleet, the number of locations, and annual revenue. In 2011, Hertz had 320,000 cars in service and annual revenue of approximately $4.2 billion. Suppose the following data show the number of cars in service (1,000s) and
the annual revenue ($ millions) for six smaller car rental companies.
Cars
Revenue
Company
(1,000s)
($ millions)
Company A
11.5
116
Company B
10.0
137
Company C
9.0
102
Company D
5.5
39
Company E
4.2
40
Company F
3.3
34
(a) Develop a scatter diagram with the number of cars in service as the independent variable.
160-
140-
160
160
160
120
140-
140-
140
100
120
120-
120-
80
100
100-
100-
60
80
80
80
40
60
60
60
20
40
40
40
20
20
20
4
6
8
10
12
14
2
4
6 8
10
12
14
2
4
6 8
10
12
14
4
6 8
10
12
14
Cars in Service (1,000s)
Cars in Service (1,000s)
Cars in Service (1,000s)
Cars in Service (1,000s)
(b) What does the scatter diagram developed in part (a) indicate about the relationship between the two variables?
There appears to be a negative linear relationship between cars in service (1,000s) and annual
revenue ($ millions).
o There appears to be a positive linear relationship between cars in service (1,000s) and annual
revenue ($ millions).
There appears to be no noticeable relationship between cars in service (1,000s) and annual revenue ($ millions).
(c) Use the least squares method to develop the estimated regression equation that can be used to predict annual revenue (in $ millions) given the number of cars in service (in 1,000s). (Round your numerical values to three decimal places.)
(d) For every additional car placed in service, estimate how much annual revenue will change (in dollars). (Round your answer to the nearest integer.)
Annual revenue will increase by $
, for every additional car placed in service.
(e) A particular rental company has 6,000 cars in service. Use the estimated regression equation developed in part (c) to predict annual revenue (in $ millions) for this company. (Round your answer to the nearest integer.)
million
Expert Solution
This question has been solved!
Explore an expertly crafted, step-by-step solution for a thorough understanding of key concepts.

This is a popular solution!

Trending now
This is a popular solution!

Step by step
Solved in 4 steps with 2 images

Recommended textbooks for you
Linear Algebra: A Modern Introduction
Algebra
ISBN:
9781285463247
Author:
David Poole
Publisher:
Cengage Learning

Glencoe Algebra 1, Student Edition, 9780079039897…
Algebra
ISBN:
9780079039897
Author:
Carter
Publisher:
McGraw Hill

Functions and Change: A Modeling Approach to Coll…
Algebra
ISBN:
9781337111348
Author:
Bruce Crauder, Benny Evans, Alan Noell
Publisher:
Cengage Learning
Linear Algebra: A Modern Introduction
Algebra
ISBN:
9781285463247
Author:
David Poole
Publisher:
Cengage Learning
Glencoe Algebra 1, Student Edition, 9780079039897…
Algebra
ISBN:
9780079039897
Author:
Carter
Publisher:
McGraw Hill
Functions and Change: A Modeling Approach to Coll…
Algebra
ISBN:
9781337111348
Author:
Bruce Crauder, Benny Evans, Alan Noell
Publisher:
Cengage Learning