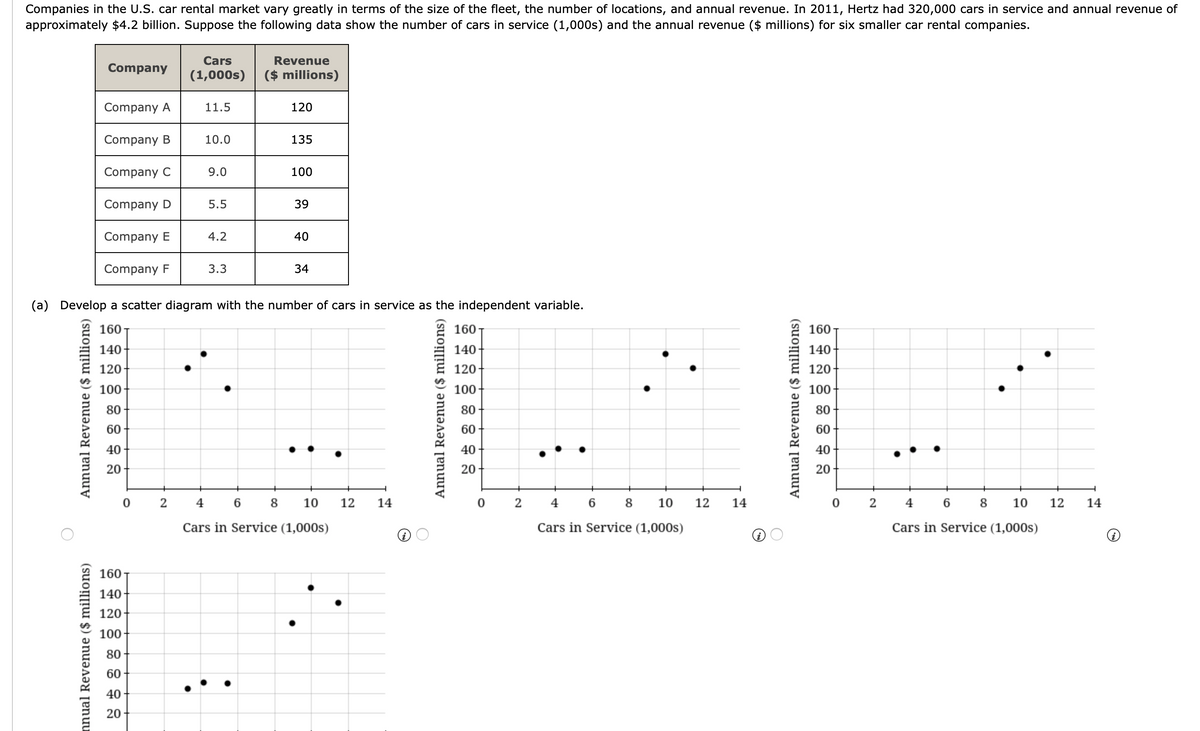
Companies in the U.S. car rental market vary greatly in terms of the size of the fleet, the number of locations, and annual revenue. In 2011, Hertz had 320,000 cars in service and annual revenue of approximately $4.2 billion. Suppose the following data show the number of cars in service (1,000s) and the annual revenue ($ millions) for six smaller car rental companies. Cars Revenue Company (1,000s) ($ millions) Company A 11.5 120 Company B 10.0 135 Company C 9.0 100 Company D 5.5 39 Company E 4.2 40 Company F 3.3 34 (a) Develop a scatter diagram with the number of cars in service as the independent variable. 160 160T 140- 160 140 140 120- 120- 120 100 100- 100- 80 80 80 60 60 60 40 .. 40 . .. 40 ... 20 20 20 2 4 6 4 6 8 10 8 10 12 14 2 4 6 8 10 12 14 12 14 Cars in Service (1,000s) Cars in Service (1,000s) Cars in Service (1,000s) 160- 140- 120 100- 80 60 ... 40 20 ual Revenue ($ millions) Annual Revenue ($ millions) Annual Revenue ($ millions) Annual Revenue ($ millions)


Unitary Method
The word “unitary” comes from the word “unit”, which means a single and complete entity. In this method, we find the value of a unit product from the given number of products, and then we solve for the other number of products.
Speed, Time, and Distance
Imagine you and 3 of your friends are planning to go to the playground at 6 in the evening. Your house is one mile away from the playground and one of your friends named Jim must start at 5 pm to reach the playground by walk. The other two friends are 3 miles away.
Profit and Loss
The amount earned or lost on the sale of one or more items is referred to as the profit or loss on that item.
Units and Measurements
Measurements and comparisons are the foundation of science and engineering. We, therefore, need rules that tell us how things are measured and compared. For these measurements and comparisons, we perform certain experiments, and we will need the experiments to set up the devices.


Trending now
This is a popular solution!

Step by step
Solved in 2 steps with 2 images


