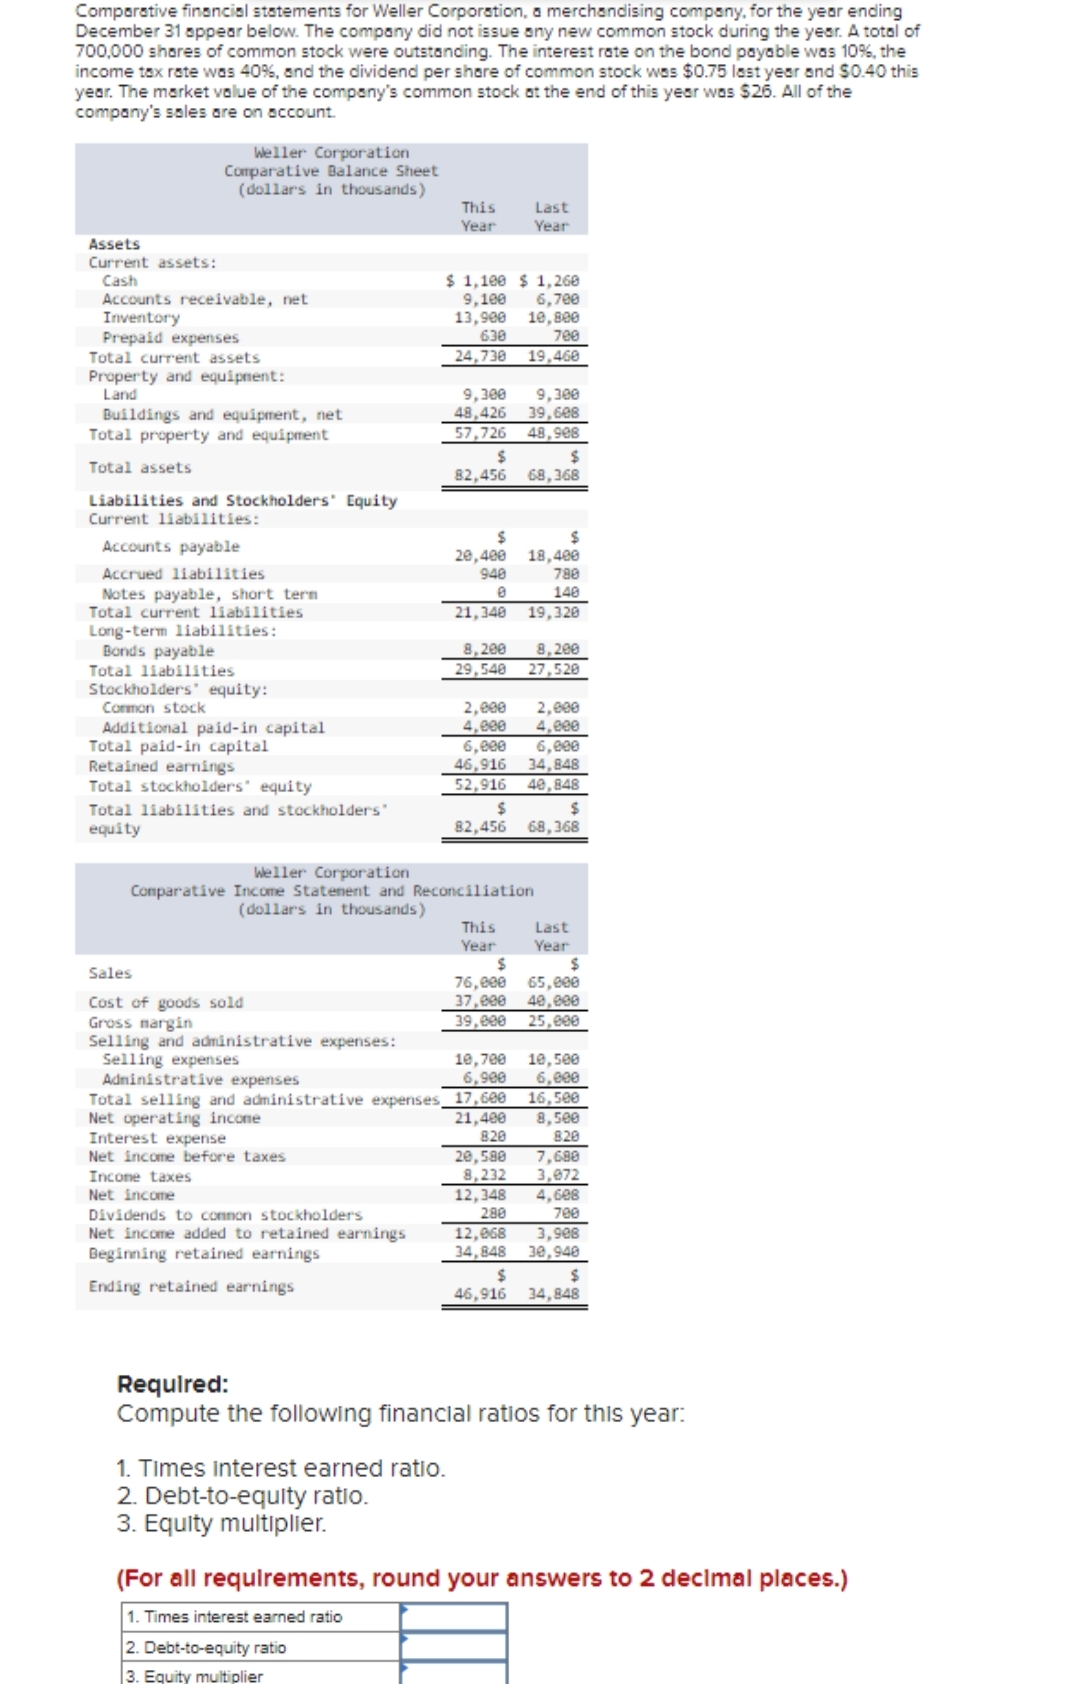
Comparative financial statements for Weller Corporation, a merchandising company, for the year ending December 31 appear below. The company did not issue any new common stock during the year. A total of 700,000 shares of common stock were outstanding. The interest rate on the bond payable was 10%, the income tax rate was 40%, and the dividend per share of common stock was $0.75 last year and $0.40 this year. The market value of the company's common stock at the end of this year was $26. All of the company's sales are on account. Assets Current assets: Cash Weller Corporation Comparative Balance Sheet (dollars in thousands) Accounts receivable, net Inventory Prepaid expenses Total current assets Property and equipment: Land Buildings and equipment, net Total property and equipment Total assets Liabilities and Stockholders' Equity Current liabilities: Accounts payable Accrued liabilities Notes payable, short term Total current liabilities Long-term liabilities: Bonds payable Total liabilities Stockholders equity: Common stock Additional paid-in capital Total paid-in capital Retained earnings Total stockholders' equity Total liabilities and stockholders" equity Sales Cost of goods sold Gross margin Selling and administrative expenses: Selling expenses This Year Interest expense Net income before taxes Income taxes Net income Dividends to common stockholders Net income added to retained earnings Beginning retained earnings Ending retained earnings $1,100 $1,260 9,100 6,700 13,900 10,800 630 700 24,730 19,460 9,300 9,300 48,426 39,608 57,726 48,908 $ 82,456 $ 20,400 948 0 21,340 2,000 4,000 8,200 8,200 29,548 27,520 Last Year Weller Corporation Comparative Income Statement and Reconciliation (dollars in thousands) This Year 6,000 6,000 46,916 34,848 52,916 40,848 Administrative expenses Total selling and administrative expenses 17,600 Net operating income 21,400 820 $ 68,368 $ $ 82,456 68,368 10,700 6,900 $ 18,400 788 140 19,320 12,068 34,848 2,000 4,000 $ $ 76,000 65,000 37,000 40,000 39,000 25,000 $ 46,916 Last Year 10,500 6,000 20,580 7,680 8,232 3,072 12,348 280 16,500 8,500 820 4,608 700 3,908 30,948 $ 34,848 Required: Compute the following financial ratios for this year: 1. Times interest earned ratio. 2. Debt-to-equity ratio. 3. Equity multiplier. (For all requirements, round your answers to 2 decimal places.)
Comparative financial statements for Weller Corporation, a merchandising company, for the year ending December 31 appear below. The company did not issue any new common stock during the year. A total of 700,000 shares of common stock were outstanding. The interest rate on the bond payable was 10%, the income tax rate was 40%, and the dividend per share of common stock was $0.75 last year and $0.40 this year. The market value of the company's common stock at the end of this year was $26. All of the company's sales are on account. Assets Current assets: Cash Weller Corporation Comparative Balance Sheet (dollars in thousands) Accounts receivable, net Inventory Prepaid expenses Total current assets Property and equipment: Land Buildings and equipment, net Total property and equipment Total assets Liabilities and Stockholders' Equity Current liabilities: Accounts payable Accrued liabilities Notes payable, short term Total current liabilities Long-term liabilities: Bonds payable Total liabilities Stockholders equity: Common stock Additional paid-in capital Total paid-in capital Retained earnings Total stockholders' equity Total liabilities and stockholders" equity Sales Cost of goods sold Gross margin Selling and administrative expenses: Selling expenses This Year Interest expense Net income before taxes Income taxes Net income Dividends to common stockholders Net income added to retained earnings Beginning retained earnings Ending retained earnings $1,100 $1,260 9,100 6,700 13,900 10,800 630 700 24,730 19,460 9,300 9,300 48,426 39,608 57,726 48,908 $ 82,456 $ 20,400 948 0 21,340 2,000 4,000 8,200 8,200 29,548 27,520 Last Year Weller Corporation Comparative Income Statement and Reconciliation (dollars in thousands) This Year 6,000 6,000 46,916 34,848 52,916 40,848 Administrative expenses Total selling and administrative expenses 17,600 Net operating income 21,400 820 $ 68,368 $ $ 82,456 68,368 10,700 6,900 $ 18,400 788 140 19,320 12,068 34,848 2,000 4,000 $ $ 76,000 65,000 37,000 40,000 39,000 25,000 $ 46,916 Last Year 10,500 6,000 20,580 7,680 8,232 3,072 12,348 280 16,500 8,500 820 4,608 700 3,908 30,948 $ 34,848 Required: Compute the following financial ratios for this year: 1. Times interest earned ratio. 2. Debt-to-equity ratio. 3. Equity multiplier. (For all requirements, round your answers to 2 decimal places.)

Financial Accounting
15th Edition
ISBN:9781337272124
Author:Carl Warren, James M. Reeve, Jonathan Duchac
Publisher:Carl Warren, James M. Reeve, Jonathan Duchac
Chapter17: Financial Statement Analysis
Section: Chapter Questions
Problem 20E: Five measures of solvency or profitability The balance sheet for Garcon Inc. at the end of the...

Related questions
Question
Transcribed Image Text:Comparative financial statements for Weller Corporation, a merchandising company, for the year ending
December 31 appear below. The company did not issue any new common stock during the year. A total of
700,000 shares of common stock were outstanding. The interest rate on the bond payable was 10%, the
income tax rate was 40%, and the dividend per share of common stock was $0.75 last year and $0.40 this
year. The market value of the company's common stock at the end of this year was $26. All of the
company's sales are on account.
Assets
Current assets:
Cash
Weller Corporation
Comparative Balance Sheet
(dollars in thousands)
Accounts receivable, net
Inventory
Prepaid expenses
Total current assets.
Property and equipment:
Land
Buildings and equipment, net
Total property and equipment
Total assets
Liabilities and Stockholders' Equity
Current liabilities:
Accounts payable
Accrued liabilities
Notes payable, short term
Total current liabilities
Long-term liabilities:
Bonds payable
Total liabilities
Stockholders equity:
Common stock
Additional paid-in capital
Total paid-in capital
Retained earnings
Total stockholders' equity
Total liabilities and stockholders'
equity
Sales
Cost of goods sold
Gross margin
Selling and administrative expenses:
Selling expenses
Interest expense
Net income before taxes
Income taxes
Net income
This
Year
Dividends to common stockholders
Net income added to retained earnings
Beginning retained earnings
Ending retained earnings
$1,100 $1,260
6,700
10,800
700
19,460
9,100
13,900
630
24,730
1. Times interest earned ratio.
2. Debt-to-equity ratio.
3. Equity multiplier.
9,300
9,300
48,426 39,608
57,726
48,908
$
82,456
$
20,400
948
0
21,340
8,200
29,540
2,000
4,000
6,000
46,916
52,916
$
82,456
Weller Corporation
Comparative Income Statement and Reconciliation
(dollars in thousands)
Administrative expenses
Total selling and administrative expenses 17,600
Net operating income
21,400
820
20,580
8,232
This
Year
10,700
6,900
Last
Year
$
68,368
12,068
34,848
$
18,400
780
140
19,320
$
46,916
8,200
27,520
2,000
4,000
6,000
34,848
40,848
$
$
65,000
76,000
37,000 40,000
39,000
25,000
$
68,368
Last
Year
10,500
6,000
7,680
3,072
12,348 4,608
280
700
16,500
8,500
820
3,908
30,940
$
34,848
Required:
Compute the following financial ratios for this year:
(For all requirements, round your answers to 2 decimal places.)
1. Times interest earned ratio
2. Debt-to-equity ratio
3. Equity multiplier
Expert Solution
This question has been solved!
Explore an expertly crafted, step-by-step solution for a thorough understanding of key concepts.

Step by step
Solved in 2 steps

Knowledge Booster


Learn more about
Need a deep-dive on the concept behind this application? Look no further. Learn more about this topic, accounting and related others by exploring similar questions and additional content below.Recommended textbooks for you
Financial Accounting
Accounting
ISBN:
9781337272124
Author:
Carl Warren, James M. Reeve, Jonathan Duchac
Publisher:
Cengage Learning

Excel Applications for Accounting Principles
Accounting
ISBN:
9781111581565
Author:
Gaylord N. Smith
Publisher:
Cengage Learning

Managerial Accounting: The Cornerstone of Busines…
Accounting
ISBN:
9781337115773
Author:
Maryanne M. Mowen, Don R. Hansen, Dan L. Heitger
Publisher:
Cengage Learning
Financial Accounting
Accounting
ISBN:
9781337272124
Author:
Carl Warren, James M. Reeve, Jonathan Duchac
Publisher:
Cengage Learning
Excel Applications for Accounting Principles
Accounting
ISBN:
9781111581565
Author:
Gaylord N. Smith
Publisher:
Cengage Learning
Managerial Accounting: The Cornerstone of Busines…
Accounting
ISBN:
9781337115773
Author:
Maryanne M. Mowen, Don R. Hansen, Dan L. Heitger
Publisher:
Cengage Learning

Financial Reporting, Financial Statement Analysis…
Finance
ISBN:
9781285190907
Author:
James M. Wahlen, Stephen P. Baginski, Mark Bradshaw
Publisher:
Cengage Learning

Intermediate Accounting: Reporting And Analysis
Accounting
ISBN:
9781337788281
Author:
James M. Wahlen, Jefferson P. Jones, Donald Pagach
Publisher:
Cengage Learning

Financial Accounting: The Impact on Decision Make…
Accounting
ISBN:
9781305654174
Author:
Gary A. Porter, Curtis L. Norton
Publisher:
Cengage Learning