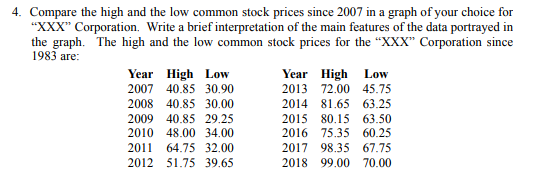
Compare the high and the low common stock prices since 2007 in a graph of your choice for "XXX" Corporation. Write a brief interpretation of the main features of the data portrayed in the graph. The high and the low common stock prices for the "XXX" Corporation since 1983 are: Year High Low 2007 40.85 30.90 2008 40.85 30.00 2009 40.85 29.25 2010 48.00 34.00 2011 64.75 32.00 2012 51.75 39.65 Year High Low 2013 72.00 45.75 2014 81.65 63.25 2015 80.15 63.50 2016 75.35 60.25 2017 98.35 67.75 2018 99.00 70.00
Compare the high and the low common stock prices since 2007 in a graph of your choice for "XXX" Corporation. Write a brief interpretation of the main features of the data portrayed in the graph. The high and the low common stock prices for the "XXX" Corporation since 1983 are: Year High Low 2007 40.85 30.90 2008 40.85 30.00 2009 40.85 29.25 2010 48.00 34.00 2011 64.75 32.00 2012 51.75 39.65 Year High Low 2013 72.00 45.75 2014 81.65 63.25 2015 80.15 63.50 2016 75.35 60.25 2017 98.35 67.75 2018 99.00 70.00

Glencoe Algebra 1, Student Edition, 9780079039897, 0079039898, 2018
18th Edition
ISBN:9780079039897
Author:Carter
Publisher:Carter
Chapter4: Equations Of Linear Functions
Section4.5: Correlation And Causation
Problem 2CYU

Related questions
Question
Transcribed Image Text:4. Compare the high and the low common stock prices since 2007 in a graph of your choice for
"XXX" Corporation. Write a brief interpretation of the main features of the data portrayed in
the graph. The high and the low common stock prices for the "XXX" Corporation since
1983 are:
Year High Low
2007 40.85 30.90
2008 40.85 30.00
2009 40.85 29.25
2010 48.00 34.00
2011 64.75 32.00
Year High Low
2013 72.00 45.75
2014 81.65 63.25
2015 80.15 63.50
2016 75.35 60.25
2017 98.35 67.75
2018 99.00 70.00
2012 51.75 39.65
Expert Solution
This question has been solved!
Explore an expertly crafted, step-by-step solution for a thorough understanding of key concepts.

This is a popular solution!

Trending now
This is a popular solution!

Step by step
Solved in 2 steps with 3 images

Recommended textbooks for you
Glencoe Algebra 1, Student Edition, 9780079039897…
Algebra
ISBN:
9780079039897
Author:
Carter
Publisher:
McGraw Hill
Glencoe Algebra 1, Student Edition, 9780079039897…
Algebra
ISBN:
9780079039897
Author:
Carter
Publisher:
McGraw Hill