Complete the following table by indicating at each price whether there is a shortage or surplus in the market, the amount of that shortage or surplus, and whether this places upward or downward pressure on prices. Price Shortage or Surplus Amount (Dollars per calendar) Shortage or Surplus (Calendars) Pressure 40 60
Complete the following table by indicating at each price whether there is a shortage or surplus in the market, the amount of that shortage or surplus, and whether this places upward or downward pressure on prices. Price Shortage or Surplus Amount (Dollars per calendar) Shortage or Surplus (Calendars) Pressure 40 60

Chapter1: Making Economics Decisions
Section: Chapter Questions
Problem 1QTC

Related questions
Question
12. Market equilibrium and disequilibrium
The following graph shows the monthly demand and supply curves in the market for calendars.
Use the graph input tool to help you answer the following questions. You will not be graded on any changes you make to this graph.
Note: Once you enter a value in a white field, the graph and any corresponding amounts in each grey field will change accordingly.
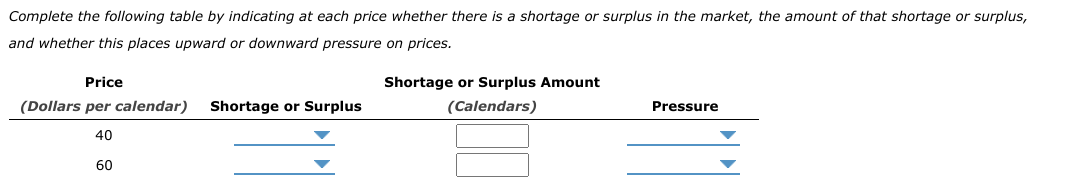
Transcribed Image Text:Complete the following table by indicating at each price whether there is a shortage or surplus in the market, the amount of that shortage or surplus,
and whether this places upward or downward pressure on prices.
Price
Shortage or Surplus Amount
(Dollars per calendar)
Shortage or Surplus
(Calendars)
Pressure
40
60
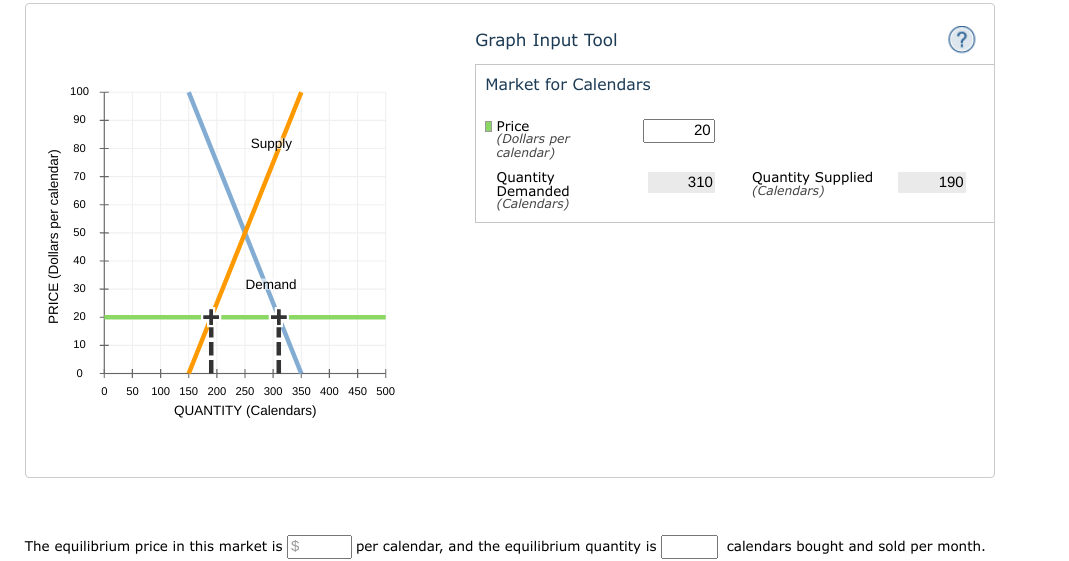
Transcribed Image Text:Graph Input Tool
Market for Calendars
100
90
I Price
(Dollars per
calendar)
20
Supply
80
70
Quantity
Demanded
(Calendars)
Quantity Supplied
(Calendars)
310
190
60
50
40
Demand
30
20
10
50
100 150 200 250 300 350 400 450 500
QUANTITY (Calendars)
The equilibrium price in this market is
per calendar, and the equilibrium quantity is
calendars bought and sold per month.
PRICE (Dollars per calendar)
Expert Solution
This question has been solved!
Explore an expertly crafted, step-by-step solution for a thorough understanding of key concepts.

This is a popular solution!

Trending now
This is a popular solution!

Step by step
Solved in 2 steps

Knowledge Booster


Learn more about
Need a deep-dive on the concept behind this application? Look no further. Learn more about this topic, economics and related others by exploring similar questions and additional content below.Recommended textbooks for you

Principles of Economics (12th Edition)
Economics
ISBN:
9780134078779
Author:
Karl E. Case, Ray C. Fair, Sharon E. Oster
Publisher:
PEARSON

Engineering Economy (17th Edition)
Economics
ISBN:
9780134870069
Author:
William G. Sullivan, Elin M. Wicks, C. Patrick Koelling
Publisher:
PEARSON
Principles of Economics (12th Edition)
Economics
ISBN:
9780134078779
Author:
Karl E. Case, Ray C. Fair, Sharon E. Oster
Publisher:
PEARSON
Engineering Economy (17th Edition)
Economics
ISBN:
9780134870069
Author:
William G. Sullivan, Elin M. Wicks, C. Patrick Koelling
Publisher:
PEARSON

Principles of Economics (MindTap Course List)
Economics
ISBN:
9781305585126
Author:
N. Gregory Mankiw
Publisher:
Cengage Learning

Managerial Economics: A Problem Solving Approach
Economics
ISBN:
9781337106665
Author:
Luke M. Froeb, Brian T. McCann, Michael R. Ward, Mike Shor
Publisher:
Cengage Learning

Managerial Economics & Business Strategy (Mcgraw-…
Economics
ISBN:
9781259290619
Author:
Michael Baye, Jeff Prince
Publisher:
McGraw-Hill Education