Complete the table by calculating the surplus or deficit both in absolute (dollar) terms and as a percentage of GDP. If necessary, round your answe to the nearest hundredth. GDP Exports Imports Exports - Imports Year (Billions of dollars) (Billions of dollars) (Billions of dollars) (Billions of dollars) (Percentage of GDP) 2006 13,399.0 1,471.0 2,240.3 2007 14,062.0 1,661.7 2,375.7 2008 14,369.0 1,843.4 2,553.8 2009 14,119.0 1,578.4 1,964.7 2010 14,660.0 1,837.5 2,353.9
Complete the table by calculating the surplus or deficit both in absolute (dollar) terms and as a percentage of GDP. If necessary, round your answe to the nearest hundredth. GDP Exports Imports Exports - Imports Year (Billions of dollars) (Billions of dollars) (Billions of dollars) (Billions of dollars) (Percentage of GDP) 2006 13,399.0 1,471.0 2,240.3 2007 14,062.0 1,661.7 2,375.7 2008 14,369.0 1,843.4 2,553.8 2009 14,119.0 1,578.4 1,964.7 2010 14,660.0 1,837.5 2,353.9

Chapter4: The Aggregate Economy
Section: Chapter Questions
Problem 5E

Related questions
Question
How do I solve this problem?
Transcribed Image Text:Homework (Ch 18)
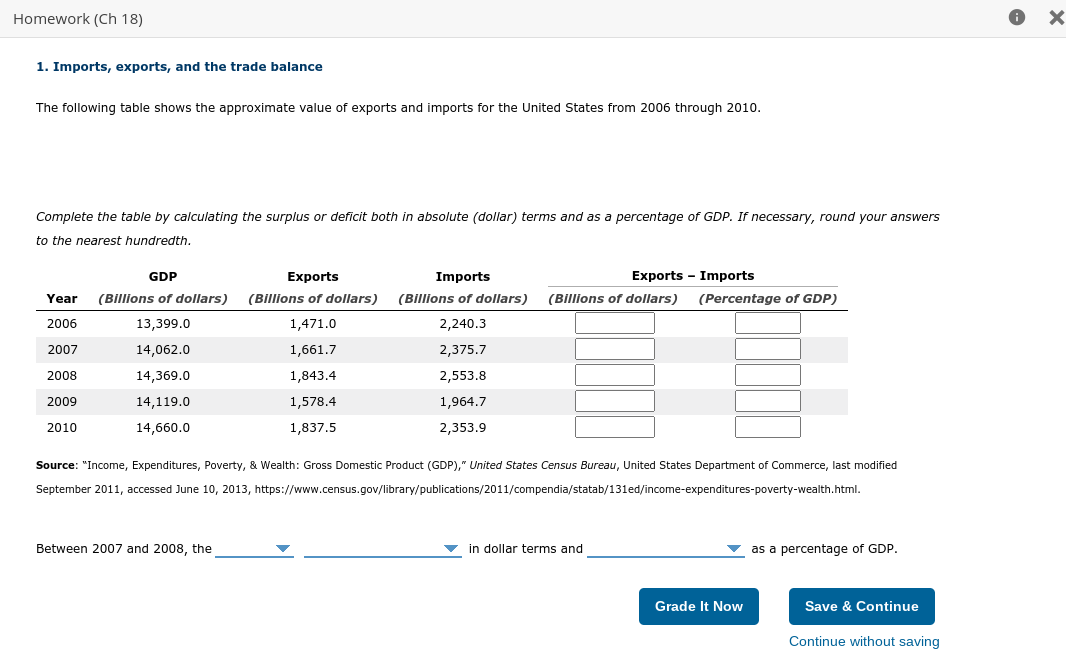
1. Imports, exports, and the trade balance
The following table shows the approximate value of exports and imports for the United States from 2006 through 2010.
Complete the table by calculating the surplus or deficit both in absolute (dollar) terms and as a percentage of GDP. If necessary, round your answers
to the nearest hundredth.
GDP
Exports
Imports
Exports - Imports
Year
(Billions of dollars)
(Billions of dollars)
(Billions of dollars)
(Billions of dollars)
(Percentage of GDP)
2006
13,399.0
1,471.0
2,240.3
2007
14,062.0
1,661.7
2,375.7
2008
14,369.0
1,843.4
2,553.8
2009
14,119.0
1,578.4
1,964.7
2010
14,660.0
1,837.5
2,353.9
Source: "Income, Expenditures, Poverty, & Wealth: Gross Domestic Product (GDP)," United States Census Bureau, United States Department of Commerce, last modified
September 2011, accessed June 10, 2013, https://www.census.gov/library/publications/2011/compendia/statab/131ed/income-expenditures-poverty-wealth.html.
Between 2007 and 2008, the
in dollar terms and
as a percentage of GDP.
Grade It Now
Save & Continue
Continue without saving
Expert Solution
This question has been solved!
Explore an expertly crafted, step-by-step solution for a thorough understanding of key concepts.

This is a popular solution!

Trending now
This is a popular solution!

Step by step
Solved in 2 steps

Knowledge Booster


Learn more about
Need a deep-dive on the concept behind this application? Look no further. Learn more about this topic, economics and related others by exploring similar questions and additional content below.Recommended textbooks for you

Principles of Economics 2e
Economics
ISBN:
9781947172364
Author:
Steven A. Greenlaw; David Shapiro
Publisher:
OpenStax

Brief Principles of Macroeconomics (MindTap Cours…
Economics
ISBN:
9781337091985
Author:
N. Gregory Mankiw
Publisher:
Cengage Learning
Principles of Economics 2e
Economics
ISBN:
9781947172364
Author:
Steven A. Greenlaw; David Shapiro
Publisher:
OpenStax
Brief Principles of Macroeconomics (MindTap Cours…
Economics
ISBN:
9781337091985
Author:
N. Gregory Mankiw
Publisher:
Cengage Learning